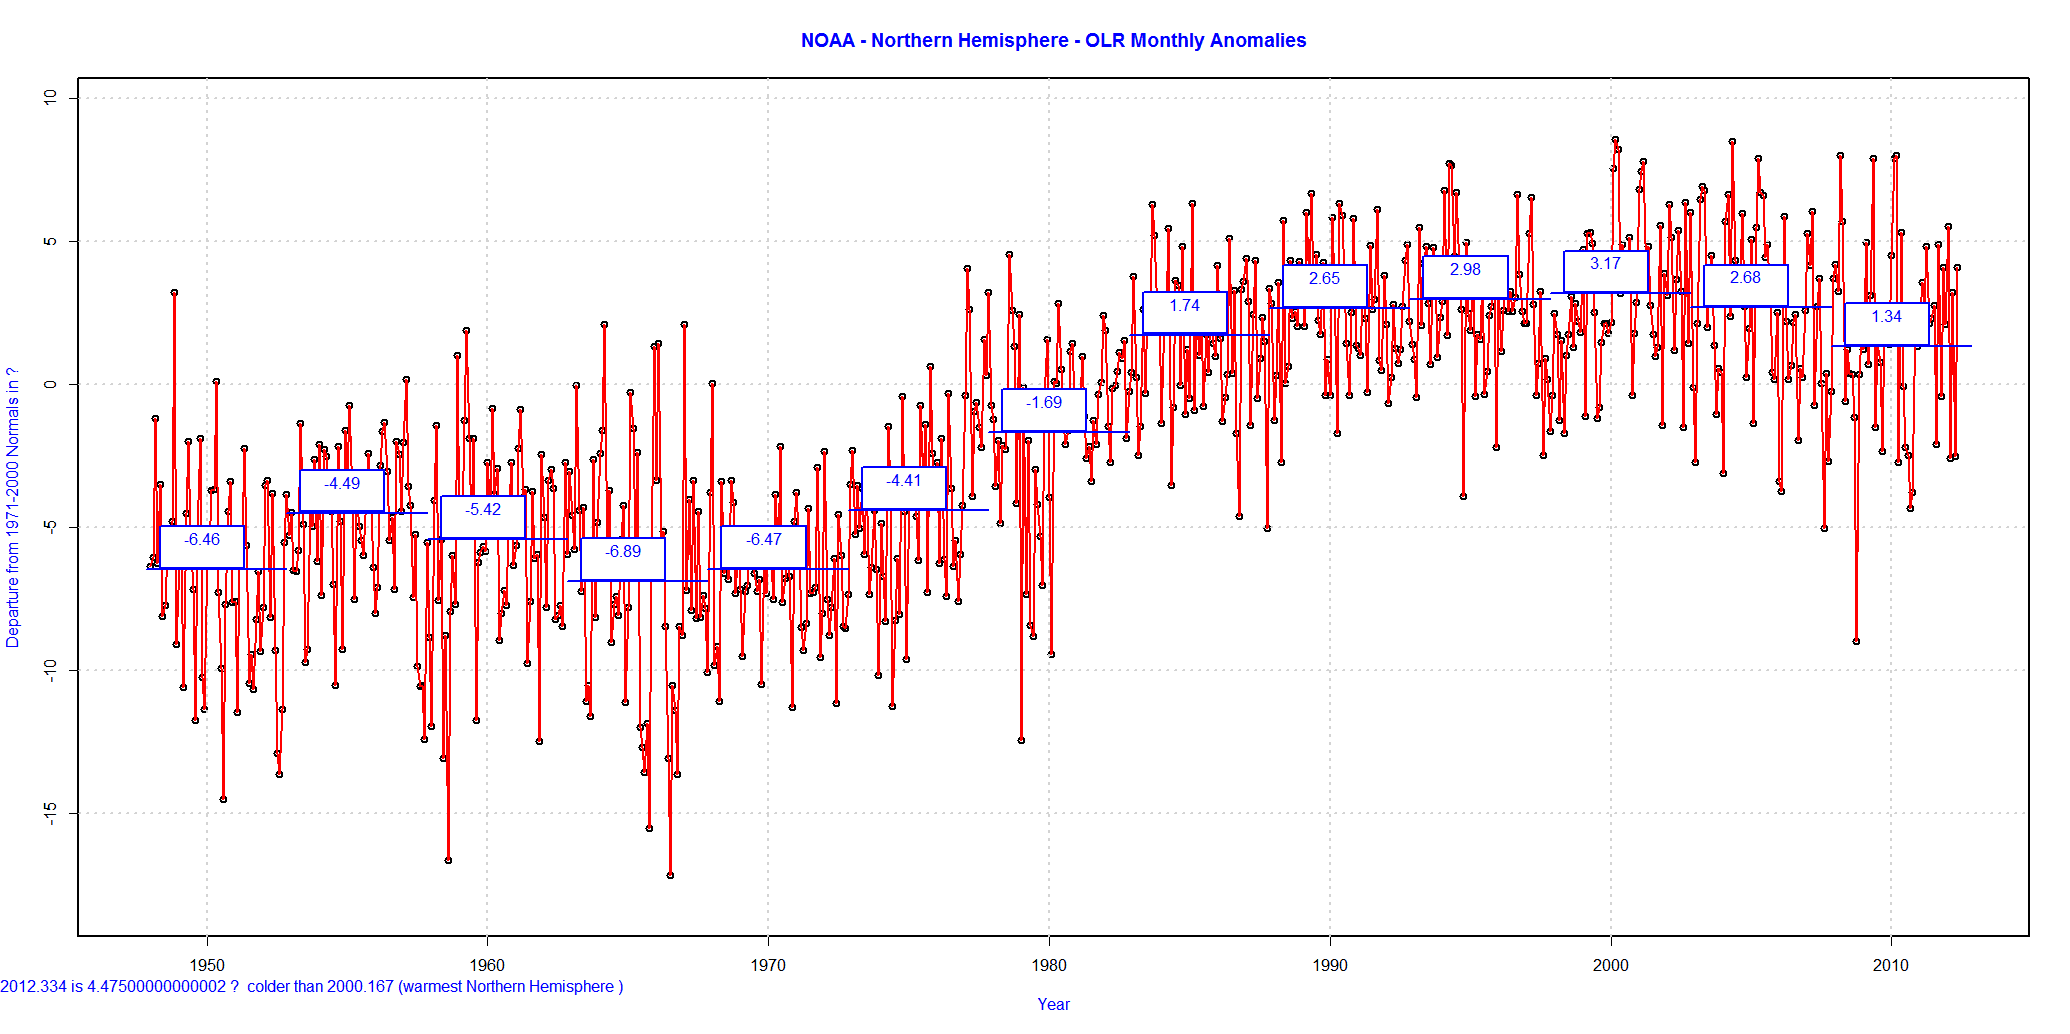
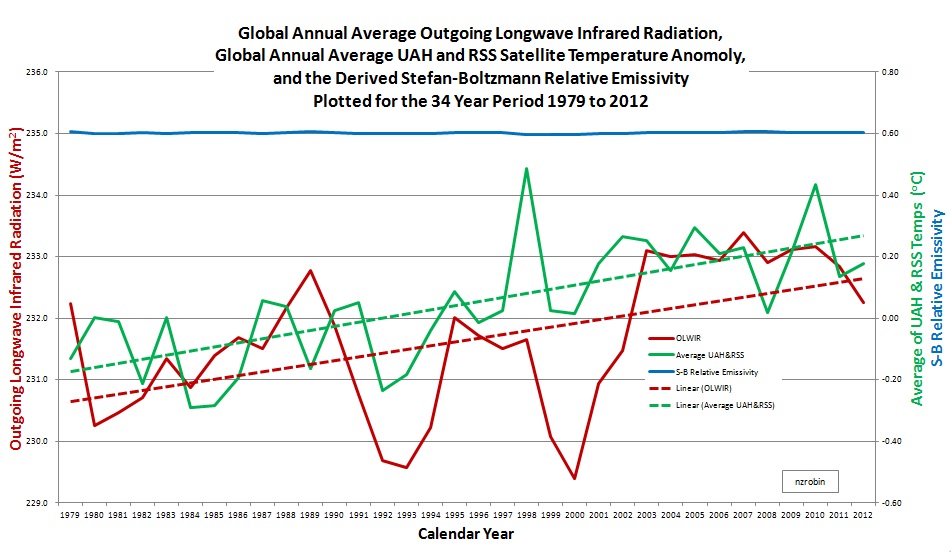
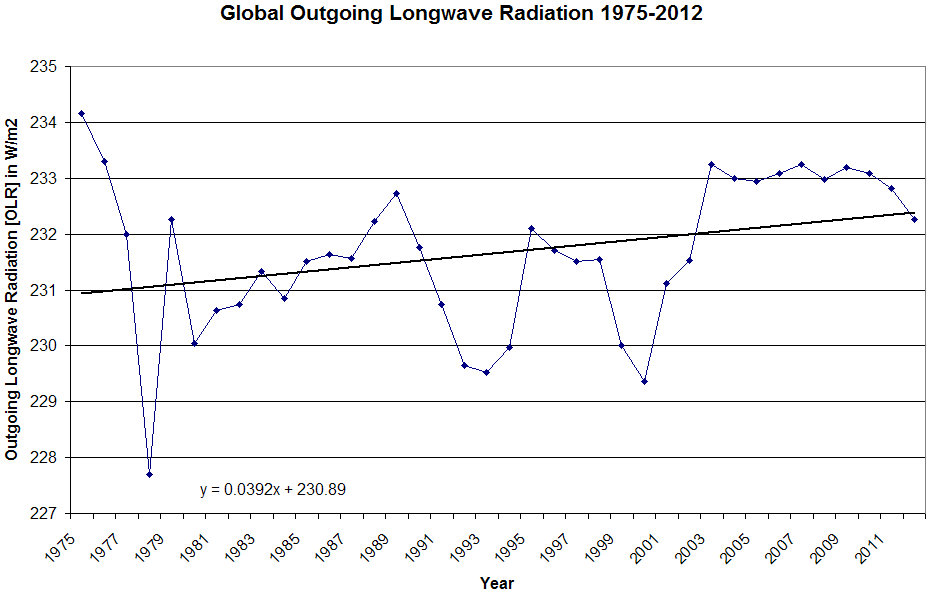
Radiation escaping at the TOA is on the increase as it has been for some time....indicating that the earth is losing heat.
Check it out! SSDD is back with his mystery graph!
He's like Billy in that regard. The use of unsourced mystery graphs composed of faked data is a tactic common to all Sky Dragon Slayers. I suppose we might be able to find the origin of the faked graphic if we delved deeply enough into the bowels of PSI or Hockey Schtick, but I doubt anyone cares that much.
In addition a paper recently published in the Geophysical Research Letters
As far as the Zhou 2015 paper goes, if fails to mention that most models, including all of the mainstream ones, don't use that old solar approximation. Only a handful of minor models use the old solar approximation, with only a single old dodgy Russian model being bad enough to vary by 30 W/m^2. And even for that kind of models that did vary like that, the errors varied equally in both directions over the day.
That is, much ado about nothing. And such nothings are always the best the deniers have.
And even though SSDD now knows his claims here are bullshit, he'll keep trying to pass them off, since he believes he has a special dispensation to lie, handed to him by God and his cult.