Climate models go cold

Albert Einstein once said:
“Two things are infinite: the universe and human stupidity; and I'm not sure about the the universe.”


First of all, they were not talking about random events or cause and effect but the accuracy of the warming trend.

But even using your deflection, if an event has only a 5% chance of being RANDOM, would it not have a 95% chance of having a CAUSE????
What a pinhead! :rofl::lmao:

Who is the pinhead here...??? You are an utter fucking retard.. Blah Blah Blah
You are projecting because you couldn't answer the simple question!!!
If an event is not random does it not have a cause?


Show me exactly where and in which of your dumb posts you asked me this foolish question :
If an event is not random does it not have a cause?
that you say I could not answer

I am telling you over and over again that the statistical significance to back up the hypothesis that CO2 drives temperature is way out of line ,

Temperatures have been up and down INDEPENDENTLY of CO2 levels for millennia, thus the statistical significance was always outside the 5% limit ever since this quack "science" got off the ground

and even this fool Phil Jones knows it and had to admit that over and over again....after his assertions have been scrutinized by Mathematicians and almost the entire international News Media caught wind of it....Jones also pleaded the same ignorance as your`s of REAL math as a cop out to avoid fraud charges in the UK.

I`ll explain it to you one last time,...:

In the Null hypothesis which is the only scientifically accepted form a hypothesis is stipulated in REAL SCIENCE, that the failure to be within the acceptable statistical significance limit means that any synchronicity between temperature change and CO2 change was a random event

To make a valid claim any REAL SCIENTIST must first show, that the statistical significance is showing that there is only a 5% CHANCE that temperature can go up independently from CO2 .

If You can`t do it, then in Mathematics that means that if at any one time the temp went up the same time as the CO2 did, that it was a random event....
or a coincidence, a freak event... or whatever simpler words you and the likes of you uneducated loudmouths-moron liberals here prefer


How the fuck can anyone be so stupid not to understand that?

But even using your deflection, if an event has only a 5% chance of being RANDOM, would it not have a 95% chance of having a CAUSE????
What a pinhead...blah blah blah
If an event is not random does it not have a cause?
It still didn`t penetrate into your little dense head...by the way which of your 2 heads does your "thinking"...? The one on your neck or the other one in your pants?

Do us all a favor and try this out...:
Get a .38 Smith&Wesson and load every chamber except one and see how many times You can play "Russian Roulette"..
You have a 1 in 6 Chance to survive = expressed as 16.6% statistical significance
Now go ahead and satisfy a HARD SCIENCE NULL HYPOTHESIS that pulling a trigger on a 5/6 th loaded firearm results in death..

and You must do it often enough till you can satisfy the 5% statistical significance rule showing that the gun just went "click" instead of "bang"
was sheer luck that only happens 5% of the time...
so unless you can persuade some more liberal anti-gun crack heads to volunteer for your statistical study, don`t start out putting the gun to the pin-head on the upper end of your food to shit and piss conversion worm, start out with the head on the other end where all the other piss and shit emanating from you comes out...in case the non-random event , meaning the gun does go off happens before you established the 5% statistical significance

Then we`ll write your obituary and mention you have stated a statistically valid null hypothesis that shows that someone not playing with a full deck (like you) and a gun + some ammo will get killed, and that you have left behind data that backs up this hypothesis with a statistical significance of 5%

So, where exactly did I not answer the question you never asked to begin with...using your pinhead jibberish...:

You are projecting because you couldn't answer the simple question!!!
If an event is not random does it not have a cause?
As if I had nothing better to do than sit there all day long reading the kind of retard crap You and your moron friends are writing in this forum here
Like your "counter argument" against Westwall :
The NO Jones was not agreeing to, that you CON$ dishonestly edited his answer to make it appear that he was agreeing to NO global warming rather than the NO statistical-significance due to a slight lack of TIME and not a lack of WARMING.
Well that`s exactly the problem with this quack science isn`t it you pin-head...:


"due to a slight lack of TIME to show,... using scientifically sound statistical methods,.. that +0.12 C has anything to do with CO2

and the "too short time" Phil Jones is referring to, and got caught cheating, was the "too short time" to qualify for an acceptable level of statistical significance has been dubbed 'The Hockey Stick"...
But this quack science went on using it to fabricate a fraudulent hypothesis, a fraud which he and all those associated with him perpetrated on the public at large...
And it was indeed a freak coincidence that the entire lot did not wind up behind bars after the British Parliament pondered laying criminal fraud charges against him + his organization...

By the way this is far from over...they have not stopped at the international crimes commission in Brussels accumulating enough evidence to make it stick the next time..
Phil Jones is well aware of that, that`s why he keeps answering pointed questions nailing his pudding to the wall with a "noyeah"....

This "slightly too short time" is called "The Hockey Stick" ...by the entire world, with the few freak exceptions of some fringe lunatics like you, Thudhead and rock-head

Don`t believe me...?...let`s see what happens if you enter @ Google "the hockey stick"...:
the hockey stick - Google Search

About 7,510,000 results (0.15 seconds)
go ahead and click on that Google search result link...
Or maybe deep down in your shit gut you have that nagging feeling that you and morons just like you are the freak event...
Using these Google hit results up in that link there nobody would have any trouble at all proving with a statistical significance error margin of less than 0.00001 % that You and your "global warming" asshole quack "science" are the freak/random event of the millennium

What`s that supposed to be anyway...is that a web cam shot of your freak cyclops pin-head ?

avatar13101_1.gif


Hey I have to copy & paste this post here into "Open Office" for a quick and lazy word count, then e-mail it it for my $.25 per word hobby income, ....a few more posts like this one and I can buy that nice Mig-welder I was eying in town today
But maybe I`ll look around here some more first,,,...see what more moron stuff has been posted in these "Enviro" threads here...
But it`s been good hunting in this here thread so far and it`s been easier than making road kill out of toads
 
Last edited:
I gotta say............I love when Polar comes in here and schools the shit out of the k00k alarmists!!! Their responses are like spit balls on an M1 tank.

Or..........slingshot animals................

YouTube - Flying Frog Slingshot from Stupid.com


I was only saying what everybody who had to study Math to the bitter end as a job requirement has been saying also...at the UK Parliament hearings + the ongoing investigations in Brussels and at the U.S. Congress ..====>
http://docs.google.com/viewer?a=v&q=cache:gNdSDK77M1EJ:www.uoguelph.ca/~rmckitri/research/WegmanReport.pdf+the+hockey+stick&hl=en&pid=bl&srcid=ADGEESgZV5o6rsoDZ8fpVX2Cy78BXtec0JVPq8MZHNCx0JIZkPdhYq0lu5iQM8zUIQFGQYjWmi8jhLQ-O1b66F1dZRm3a1E7KlKB9HNVkFKisWa4N34NdV73AJFz1YIcLjIwJ6Kmrnge&sig=AHIEtbSyLvXFSCILbvjHf-WZmHmnRNNlew


viewer


viewer


viewer

viewer


viewer


viewer


viewer


viewer


viewer


And here is a detailed Math Analysis how the how this statistical cheat was put together


viewer


viewer


Here is the same thing what I was posting, but the pin- thud- and Rockheads in this here forum simply can`t comprehend anything beyond a Kindergarten education level...:

viewer


And here is that simpleton linear math relation ship I pointed out with the graphs I`ve been uploading...
Not as a graphed function, but using erudite
words and the language of Mathematics
viewer


I showed that here too...how huge the error in these climate model projections are...as a graph, rather that in words, although I would have gotten paid more had I used words instead of pictures:

viewer


And here is the summary..:

viewer


Yeah I picked out the gems, why should I not...?

whoever wants to, can read the entire 91 page Report themselves...here is the link to it...so You can quick view it instead of hauling down the entire pdf file...:

http://docs.google.com/viewer?a=v&q=cache:gNdSDK77M1EJ:www.uoguelph.ca/~rmckitri/research/WegmanReport.pdf+the+hockey+stick&hl=en&pid=bl&srcid=ADGEESgZV5o6rsoDZ8fpVX2Cy78BXtec0JVPq8MZHNCx0JIZkPdhYq0lu5iQM8zUIQFGQYjWmi8jhLQ-O1b66F1dZRm3a1E7KlKB9HNVkFKisWa4N34NdV73AJFz1YIcLjIwJ6Kmrnge&sig=AHIEtbSyLvXFSCILbvjHf-WZmHmnRNNlew
 
Last edited:
I even gave you a wiki-page reference link, where You could have read up what a 95% significance level means in REAL MATH...
And as expected You + your moron friends here simply can`t comprehend it..nor can this idiot Phil Jones who likes to brag using buzzwords like "statistical significance" without even having the slightest clue of the mathematical concept behind this terminology.
There was fuck all edited...he really is as stupid as the interview revealed.

A significance level of 5% means in REAL MATH that there was only a 5% Chance that the event was random.

While You + Your moron friends, including "scientist" Phil Jones assumed that a " 95% significance level" states a 95% confidence that event [A] causes an effect .


Wow, you really are braindead.

Your nonsense was debunked back in post #122 but apparently you're so lost in the ozone that you're incapable of comprehending the facts. Try again.

As I said: Oh, PeanutBrain, you are such a clueless idiot with such ridiculous pretensions. You have no idea what you're talking about. You've got this point completely reversed.

Significance in Statistics & Surveys
(excerpts)

Significance levels show you how likely a result is due to chance. The most common level, used to mean something is good enough to be believed, is .95. This means that the finding has a 95% chance of being true. However, this value is also used in a misleading way. No statistical package will show you "95%" or ".95" to indicate this level. Instead it will show you ".05," meaning that the finding has a five percent (.05) chance of not being true, which is the converse of a 95% chance of being true. To find the significance level, subtract the number shown from one. For example, a value of ".01" means that there is a 99% (1-.01=.99) chance of it being true. In this table, there is probably no difference in purchases of gasoline X by people in the city center and the suburbs, because the probability is .795 (i.e., there is only a 20.5% chance that the difference is true). In contrast the high significance level for type of vehicle (.001 or 99.9%) indicates there is almost certainly a true difference in purchases of Brand X by owners of different vehicles in the population from which the sample was drawn.

The Survey System uses significance levels with several statistics. In all cases, the p value tells you how likely something is to be not true. If a chi square test shows probability of .04, it means that there is a 96% (1-.04=.96) chance that the answers given by different groups in a banner really are different. If a t-test reports a probability of .07, it means that there is a 93% chance that the two means being compared would be truly different if you looked at the entire population.

People sometimes think that the 95% level is sacred when looking at significance levels. If a test shows a .06 probability, it means that it has a 94% chance of being true. You can't be quite as sure about it as if it had a 95% chance of being be true, but the odds still are that it is true. The 95% level comes from academic publications, where a theory usually has to have at least a 95% chance of being true to be considered worth telling people about. In the business world if something has a 90% chance of being true (probability =.1), it can't be considered proven, but it is probably better to act as if it were true rather than false.


Yeah.......but the "Braindead" are..................


2010_Mustang_burnout_WG-2.jpg


Of course, the legislators from the most far left nutty ass districts still bring climate change legislation to the floor these days............

..........and it dies within days!!!!


Gobblygook temperature stuff is gay..................:fu::boobies::fu:..........although doesnt seem to matter to the k00ks who keep throwing this stuff uplike it has any relevance to anything besides being able to feel like a Forum Hero!!!
 
First of all, they were not talking about random events or cause and effect but the accuracy of the warming trend.

But even using your deflection, if an event has only a 5% chance of being RANDOM, would it not have a 95% chance of having a CAUSE????
What a pinhead! :rofl::lmao:

Who is the pinhead here...??? You are an utter fucking retard.. Blah Blah Blah
You are projecting because you couldn't answer the simple question!!!
If an event is not random does it not have a cause?

Albert Einstein once said:
“Two things are infinite: the universe and human stupidity; and I'm not sure about the the universe.”
Show me exactly where and in which of your dumb posts you asked me this foolish question :
that you say I could not answer

I am telling you over and over again that the statistical significance to back up the hypothesis that CO2 drives temperature is way out of line , [mindless rant, rant, rant...]
First of all the question was in the first quote box of the very post you answered!!! What a moron!!! :rofl:
As I pointed out in this very thread, when CON$ know they are wrong they play dumb.

And your rant about CO2 has nothing to do with the dishonestly edited answer Jones gave to the BBC! Nowhere in the question was CO2 even mentioned. The question had to do with whether there was global warming over a certain period of time. The answer was that there was warming during the period but the period of time was not long enough to be statistically-significant.

Maybe it isn't a dumb ACT???? You might just be as ignorant as you pretend to be!!!

Here is the BBC question and Jones' unedited answer, please highlight where CO2 is mentioned.
Thank you in advance.

BBC - Do you agree that from 1995 to the present there has been no statistically-significant global warming

Phil Jones: Yes, but only just. I also calculated the trend for the period 1995 to 2009. This trend (0.12C per decade) is positive, but not significant at the 95% significance level. The positive trend is quite close to the significance level. Achieving statistical significance in scientific terms is much more likely for longer periods, and much less likely for shorter periods.
 
Uhhhhhh, you still havn't explained how agreeing with a no means yes. On this planet english means pretty much if you agree with a no that means the answer is no. On your planet things may be different so please educate us how things are on your planet.


And, I edited nothing. I used the full quote you provided.
And when CON$ are caught playing too dumb to know they are lying, they just continue playing dumb and continue to lie.
Thank you again.

I already explained what "no" he was agreeing to, the part of Jones' answer you edited out.

You have yet to explain how a +.12C per decade warming trend means NO warming. The NO Jones was not agreeing to, that you CON$ dishonestly edited his answer to make it appear that he was agreeing to NO global warming rather than the NO statistical-significance due to a slight lack of TIME and not a lack of WARMING.

BBC - Do you agree that from 1995 to the present there has been no statistically-significant global warming

Phil Jones: Yes, but only just. I also calculated the trend for the period 1995 to 2009. This trend (0.12C per decade) is positive, but not significant at the 95% significance level. The positive trend is quite close to the significance level. Achieving statistical significance in scientific terms is much more likely for longer periods, and much less likely for shorter periods.
I'm going to edit for clarity now for others who like you can't comprehend the English Language......

BBC "Has there been any warming of significance?" Phil Jones "No, but only just."
No you are dishonestly editing for others who like you are pathological liars.
I'll edit it so even you can understand it.

BBC: "Has there been any warming of significance from 1995 to the present?"

Phil Jones: "There was +.12C warming during the period, but the period of time was not quite long enough to be statistically-significant."
 
Who is the pinhead here...??? You are an utter fucking retard.. Blah Blah Blah
You are projecting because you couldn't answer the simple question!!!
If an event is not random does it not have a cause?

Albert Einstein once said:
“Two things are infinite: the universe and human stupidity; and I'm not sure about the the universe.”
Show me exactly where and in which of your dumb posts you asked me this foolish question :
that you say I could not answer

I am telling you over and over again that the statistical significance to back up the hypothesis that CO2 drives temperature is way out of line , [mindless rant, rant, rant...]
First of all the question was in the first quote box of the very post you answered!!! What a moron!!! :rofl:
As I pointed out in this very thread, when CON$ know they are wrong they play dumb.

And your rant about CO2 has nothing to do with the dishonestly edited answer Jones gave to the BBC! Nowhere in the question was CO2 even mentioned. The question had to do with whether there was global warming over a certain period of time. The answer was that there was warming during the period but the period of time was not long enough to be statistically-significant.

Maybe it isn't a dumb ACT???? You might just be as ignorant as you pretend to be!!!

Here is the BBC question and Jones' unedited answer, please highlight where CO2 is mentioned.
Thank you in advance.

BBC - Do you agree that from 1995 to the present there has been no statistically-significant global warming

Phil Jones: Yes, but only just. I also calculated the trend for the period 1995 to 2009. This trend (0.12C per decade) is positive, but not significant at the 95% significance level. The positive trend is quite close to the significance level. Achieving statistical significance in scientific terms is much more likely for longer periods, and much less likely for shorter periods.


Reread what he said then take a reading comprehension class at your local community college. Where do you come up with this stuff!
 
edthecynic doesnt believe that his side needs to follow the rules of science. neither do a lot of scientists on the Hockey Team. can you imagine what the statistical significance of the proxy records are?
 
I even gave you a wiki-page reference link, where You could have read up what a 95% significance level means in REAL MATH...
And as expected You + your moron friends here simply can`t comprehend it..nor can this idiot Phil Jones who likes to brag using buzzwords like "statistical significance" without even having the slightest clue of the mathematical concept behind this terminology.
There was fuck all edited...he really is as stupid as the interview revealed.

A significance level of 5% means in REAL MATH that there was only a 5% Chance that the event was random.

While You + Your moron friends, including "scientist" Phil Jones assumed that a " 95% significance level" states a 95% confidence that event [A] causes an effect .


Wow, you really are braindead.

Your nonsense was debunked back in post #122 but apparently you're so lost in the ozone that you're incapable of comprehending the facts. Try again.

As I said: Oh, PeanutBrain, you are such a clueless idiot with such ridiculous pretensions. You have no idea what you're talking about. You've got this point completely reversed.

Significance in Statistics & Surveys
(excerpts)

Significance levels show you how likely a result is due to chance. The most common level, used to mean something is good enough to be believed, is .95. This means that the finding has a 95% chance of being true. However, this value is also used in a misleading way. No statistical package will show you "95%" or ".95" to indicate this level. Instead it will show you ".05," meaning that the finding has a five percent (.05) chance of not being true, which is the converse of a 95% chance of being true. To find the significance level, subtract the number shown from one. For example, a value of ".01" means that there is a 99% (1-.01=.99) chance of it being true. In this table, there is probably no difference in purchases of gasoline X by people in the city center and the suburbs, because the probability is .795 (i.e., there is only a 20.5% chance that the difference is true). In contrast the high significance level for type of vehicle (.001 or 99.9%) indicates there is almost certainly a true difference in purchases of Brand X by owners of different vehicles in the population from which the sample was drawn.

The Survey System uses significance levels with several statistics. In all cases, the p value tells you how likely something is to be not true. If a chi square test shows probability of .04, it means that there is a 96% (1-.04=.96) chance that the answers given by different groups in a banner really are different. If a t-test reports a probability of .07, it means that there is a 93% chance that the two means being compared would be truly different if you looked at the entire population.

People sometimes think that the 95% level is sacred when looking at significance levels. If a test shows a .06 probability, it means that it has a 94% chance of being true. You can't be quite as sure about it as if it had a 95% chance of being be true, but the odds still are that it is true. The 95% level comes from academic publications, where a theory usually has to have at least a 95% chance of being true to be considered worth telling people about. In the business world if something has a 90% chance of being true (probability =.1), it can't be considered proven, but it is probably better to act as if it were true rather than false.


Here comes an even bigger retard who just read an explanation for dummies and is still as dumb as before
Significance in Statistics & Surveys - What is Significance, the Meaning of Statistical Significance - Creative Research Systems

what the mathematical definition of STATISTICAL SIGNIFICANCE is and still confuses % probability with statistical significance...even though that web page he quoted explained it rather well
Significance in Statistics & Surveys

"Significance level" is a misleading term that many researchers do not fully understand. This article may help you understand the concept of statistical significance and the meaning of the numbers produced by The Survey System.
This article is presented in two parts. The first part simplifies the concept of statistical significance as much as possible; so that non-technical readers can use the concept to help make decisions based on their data.
................
Significance levels show you how likely a result is due to chance.

No statistical package will show you "95%" or ".95" to indicate this level. Instead it will show you ".05,"
which is the converse of a 95% chance of being true
Fuck by now even a fully tanked skid row drunk would have grasped the mathematical concept...
But as could have been expected with a 99.9999 % propability not by retards like you

Now let`s go back to the BBC interview and check if Phil Jones kept saying over and over again STATISTICAL SIGNIFICANCE or if he even once used the term % PROPABILITY

BBC News - Q&A: Professor Phil Jones

Oooops what have we here

B - Do you agree that from 1995 to the present there has been no statistically-significant global warming
Yes, but only just. I also calculated the trend for the period 1995 to 2009. This trend (0.12C per decade) is positive, but not significant at the 95% significance level. The positive trend is quite close to the significance level. Achieving statistical significance in scientific terms is much more likely for longer periods, and much less likely for shorter periods.
C - Do you agree that from January 2002 to the present there has been statistically significant global cooling?
No. This period is even shorter than 1995-2009. The trend this time is negative (-0.12C per decade), but this trend is not statistically significant.
Do You see the word % probability mentioned anywhere in that statement where this Climate Clown said 95% significance level...


Apparently Phil Jones needs to read the same web page with the explanation for math dummies what the difference of STATISTICAL SIGNIFICANCE and % PROBABILITY is...
Maybe he`d be able to finally grasp the mathematical concept of statistical significance...

I know full well what he was trying to say, but it serves rather well to show how just ignorant these climate quacks are when it comes to REAL SCIENCE..

But you...???? You just plastered the evidence how retarded you are all over the post you just published here

I`ll quote it in a few seconds, because I have to log out here first, so I can see what the retards on my ignore list have been farting out their assholes..

Aaah here we go...:

RollingThunder
user_offline.gif
Registered User
Member #22971
Your nonsense was debunked back in post #122 but apparently you're so lost in the ozone that you're incapable of comprehending the facts. Try again.

As I said: Oh, PeanutBrain, you are such a clueless idiot with such ridiculous pretensions. You have no idea what you're talking about. You've got this point completely reversed.
This is worth printing out as a hard copy and keeping on the trophy shelf as an example just how stupid warmer Glow Ball lunatics can be


Phil Jones learned his lessons the hard way what happens when you keep bragging using science buzz words without even knowing what they REALLY mean

Fuck I`m an optimist through and through, yet I never thought that your shit would blow up in your own face that easily..
You have no idea what you're talking about. You've got this point completely reversed.
maybe I should take you of my ignore list again..like I did with Rocks for brains...because I love sniping for internet forum asshole targets, that present the opportunity just as much as any U.S. Marine sniper loves blowing out the shit brains of the assholes he has sworn to kill.
But targeting the total retards like you and your cronies here... that`s about as sporting as blowing out water melon heads at a point blank range
 
Last edited:
Hope the levees in N'awlins hold...
:confused:
Fierce forecast: Feds predict up to 10 Atlantic hurricanes in 2011
19 May`11 - Federal forecasters Thursday called for an "above-normal" hurricane season this year. They predict anywhere from 12-18 named storms to form in the Atlantic Ocean, Caribbean Sea and Gulf of Mexico.
Of those named storms, six to 10 should become hurricanes, including three to six "major" hurricanes, with wind speeds above 111 mph. Tropical storms are given a name when wind speeds reach 39 mph. They are upgraded to hurricane status when their sustained winds reach 74 mph. An average Atlantic hurricane season sees 11 named storms, including six hurricanes; two become major hurricanes. Forecasters do not predict the number of storms that will make landfall.

Climate factors in this outlook include unusually warm Atlantic Ocean water and temperatures two degrees above average, reports Gerry Bell, lead seasonal forecaster at the Climate Prediction Center. Additionally, the impacts of the La Nina climate pattern, such as reduced wind shear, are expected to continue into the hurricane season. "In addition to multiple climate factors, seasonal climate models also indicate an above-normal season is likely, and even suggest we could see activity comparable to some of the active seasons since 1995," Bell said.

Since 1995, Bell says the Atlantic is in an era of increased hurricane activity. There are consistently favorable ocean and atmospheric conditions for storm formation. Thursday's NOAA forecast is similar to earlier predictions by researchers at Colorado State University and the AccuWeather commercial weather service. The Colorado State team, led by William Gray and Phil Klotzbach, forecasts that 16 named storms will form in the Atlantic basin; it says there is a 72% chance of a major hurricane striking land. AccuWeather predicts that 15 named storms will form, of which eight should be hurricanes.

The season officially runs June 1 through Nov. 30. However, most hurricanes tend to form from August through October, according to National Hurricane Center records. The first storm of this year in the Atlantic, Caribbean or Gulf of Mexico will be Arlene, followed by Bret, Cindy, Don and Emily. Forecasters also released their prediction for the Eastern Pacific basin, where nine to 15 named storms are expected, which would be a below-normal season. An average Eastern Pacific hurricane season produces 15 to 16 named storms. Eastern Pacific storms and hurricanes primarily stay out to sea and seldom affect the USA, although some storms do hit the west coast of Mexico.

MORE
 
Now let`s go back to the BBC interview and check if Phil Jones kept saying over and over again STATISTICAL SIGNIFICANCE or if he even once used the term % PROPABILITY

BBC News - Q&A: Professor Phil Jones

Oooops what have we here

Do You see the word % probability mentioned anywhere in that statement where this Climate Clown said 95% significance level...
Notice that when called on their bullshit CON$ then try to derail the thread and go off on a tangent!!!

You can't show where CO2 was discussed in either the BBC question or Jones' answer as you were asked to do, and you can't deny that Jones' answer was dishonestly edited to deliberately mislead about whether there was any warming from 1995 to 2009 and as a CON$ervative you can never admit the truth, so you just go off on a stupid meaningless rant over and over to pretend you are not as stupid and dishonest as you really are.
Thank You.
 
I even gave you a wiki-page reference link, where You could have read up what a 95% significance level means in REAL MATH...
And as expected You + your moron friends here simply can`t comprehend it..nor can this idiot Phil Jones who likes to brag using buzzwords like "statistical significance" without even having the slightest clue of the mathematical concept behind this terminology.
There was fuck all edited...he really is as stupid as the interview revealed.

A significance level of 5% means in REAL MATH that there was only a 5% Chance that the event was random.

While You + Your moron friends, including "scientist" Phil Jones assumed that a " 95% significance level" states a 95% confidence that event [A] causes an effect .


Wow, you really are braindead.

Your nonsense was debunked back in post #122 but apparently you're so lost in the ozone that you're incapable of comprehending the facts. Try again.

As I said: Oh, PeanutBrain, you are such a clueless idiot with such ridiculous pretensions. You have no idea what you're talking about. You've got this point completely reversed.

Significance in Statistics & Surveys
(excerpts)

Significance levels show you how likely a result is due to chance. The most common level, used to mean something is good enough to be believed, is .95. This means that the finding has a 95% chance of being true. However, this value is also used in a misleading way. No statistical package will show you "95%" or ".95" to indicate this level. Instead it will show you ".05," meaning that the finding has a five percent (.05) chance of not being true, which is the converse of a 95% chance of being true. To find the significance level, subtract the number shown from one. For example, a value of ".01" means that there is a 99% (1-.01=.99) chance of it being true. In this table, there is probably no difference in purchases of gasoline X by people in the city center and the suburbs, because the probability is .795 (i.e., there is only a 20.5% chance that the difference is true). In contrast the high significance level for type of vehicle (.001 or 99.9%) indicates there is almost certainly a true difference in purchases of Brand X by owners of different vehicles in the population from which the sample was drawn.

The Survey System uses significance levels with several statistics. In all cases, the p value tells you how likely something is to be not true. If a chi square test shows probability of .04, it means that there is a 96% (1-.04=.96) chance that the answers given by different groups in a banner really are different. If a t-test reports a probability of .07, it means that there is a 93% chance that the two means being compared would be truly different if you looked at the entire population.

People sometimes think that the 95% level is sacred when looking at significance levels. If a test shows a .06 probability, it means that it has a 94% chance of being true. You can't be quite as sure about it as if it had a 95% chance of being be true, but the odds still are that it is true. The 95% level comes from academic publications, where a theory usually has to have at least a 95% chance of being true to be considered worth telling people about. In the business world if something has a 90% chance of being true (probability =.1), it can't be considered proven, but it is probably better to act as if it were true rather than false.


Here comes an even bigger retard who just read an explanation for dummies and is still as dumb as before


Yeah and that retard is you, PeanutBrain. I put the parts you're trying to ignore in big print just for you.

And BTW, if you look at world temperatures over a longer period, like from 1960 to present, warming over this period is highly statistically significant (<0.0001%).
 
Last edited:
Wow, you really are braindead.

Your nonsense was debunked back in post #122 but apparently you're so lost in the ozone that you're incapable of comprehending the facts. Try again.

As I said: Oh, PeanutBrain, you are such a clueless idiot with such ridiculous pretensions. You have no idea what you're talking about. You've got this point completely reversed.

Significance in Statistics & Surveys
(excerpts)

Significance levels show you how likely a result is due to chance. The most common level, used to mean something is good enough to be believed, is .95. This means that the finding has a 95% chance of being true. However, this value is also used in a misleading way. No statistical package will show you "95%" or ".95" to indicate this level. Instead it will show you ".05," meaning that the finding has a five percent (.05) chance of not being true, which is the converse of a 95% chance of being true. To find the significance level, subtract the number shown from one. For example, a value of ".01" means that there is a 99% (1-.01=.99) chance of it being true. In this table, there is probably no difference in purchases of gasoline X by people in the city center and the suburbs, because the probability is .795 (i.e., there is only a 20.5% chance that the difference is true). In contrast the high significance level for type of vehicle (.001 or 99.9%) indicates there is almost certainly a true difference in purchases of Brand X by owners of different vehicles in the population from which the sample was drawn.

The Survey System uses significance levels with several statistics. In all cases, the p value tells you how likely something is to be not true. If a chi square test shows probability of .04, it means that there is a 96% (1-.04=.96) chance that the answers given by different groups in a banner really are different. If a t-test reports a probability of .07, it means that there is a 93% chance that the two means being compared would be truly different if you looked at the entire population.

People sometimes think that the 95% level is sacred when looking at significance levels. If a test shows a .06 probability, it means that it has a 94% chance of being true. You can't be quite as sure about it as if it had a 95% chance of being be true, but the odds still are that it is true. The 95% level comes from academic publications, where a theory usually has to have at least a 95% chance of being true to be considered worth telling people about. In the business world if something has a 90% chance of being true (probability =.1), it can't be considered proven, but it is probably better to act as if it were true rather than false.


Here comes an even bigger retard who just read an explanation for dummies and is still as dumb as before

Yeah and that retard is you, PeanutBrain. I put the parts you're trying to ignore in big print just for you.

And BTW, if you look at world temperatures over a longer period, like from 1960 to present, warming over this period is highly statistically significant (<0.0001%).

And you still can't show in a laboratory setting how a 60PPM increase in CO2 causes this because.........?
 
Hope the levees in N'awlins hold...
:confused:
Fierce forecast: Feds predict up to 10 Atlantic hurricanes in 2011
19 May`11 - Federal forecasters Thursday called for an "above-normal" hurricane season this year. They predict anywhere from 12-18 named storms to form in the Atlantic Ocean, Caribbean Sea and Gulf of Mexico.
Of those named storms, six to 10 should become hurricanes, including three to six "major" hurricanes, with wind speeds above 111 mph. Tropical storms are given a name when wind speeds reach 39 mph. They are upgraded to hurricane status when their sustained winds reach 74 mph. An average Atlantic hurricane season sees 11 named storms, including six hurricanes; two become major hurricanes. Forecasters do not predict the number of storms that will make landfall.

Climate factors in this outlook include unusually warm Atlantic Ocean water and temperatures two degrees above average, reports Gerry Bell, lead seasonal forecaster at the Climate Prediction Center. Additionally, the impacts of the La Nina climate pattern, such as reduced wind shear, are expected to continue into the hurricane season. "In addition to multiple climate factors, seasonal climate models also indicate an above-normal season is likely, and even suggest we could see activity comparable to some of the active seasons since 1995," Bell said.

Since 1995, Bell says the Atlantic is in an era of increased hurricane activity. There are consistently favorable ocean and atmospheric conditions for storm formation. Thursday's NOAA forecast is similar to earlier predictions by researchers at Colorado State University and the AccuWeather commercial weather service. The Colorado State team, led by William Gray and Phil Klotzbach, forecasts that 16 named storms will form in the Atlantic basin; it says there is a 72% chance of a major hurricane striking land. AccuWeather predicts that 15 named storms will form, of which eight should be hurricanes.

The season officially runs June 1 through Nov. 30. However, most hurricanes tend to form from August through October, according to National Hurricane Center records. The first storm of this year in the Atlantic, Caribbean or Gulf of Mexico will be Arlene, followed by Bret, Cindy, Don and Emily. Forecasters also released their prediction for the Eastern Pacific basin, where nine to 15 named storms are expected, which would be a below-normal season. An average Eastern Pacific hurricane season produces 15 to 16 named storms. Eastern Pacific storms and hurricanes primarily stay out to sea and seldom affect the USA, although some storms do hit the west coast of Mexico.

MORE


When have the fed NOT predicted mega-hurricane seasons? Its called CYA........and serves well and in line with the AGW hoax in the event they are correct!! Remember after Katrina?? The summer after, they predicted something like 6 or 7 Cat 5 storms.............and guess what???:rofl::rofl::rofl:

As I say.........computer models are gay...................:blowup: 
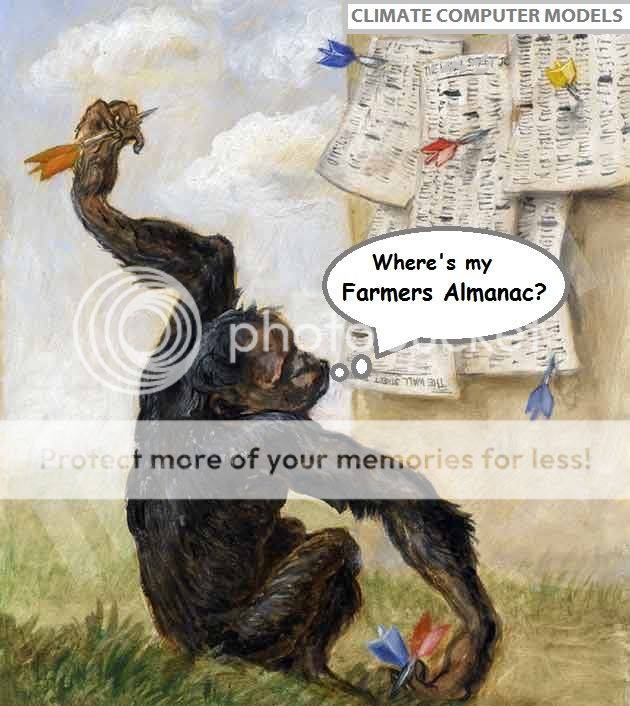
About as accurate as a guy throwing darts after finishing a 5th of gin.


Farmers Almanac FTMFW!!!!


monkey-darts.jpg
 
Last edited:

Forum List

Back
Top