Climate models go cold

Quantum Windbag

Gold Member
May 9, 2010
58,308
5,099
245
My guess is all the same idiots will make all the same posts, totally miss the point of the linked article, and continue to believe the hype. Anyone want to bat money on it?

The planet reacts to that extra carbon dioxide, which changes everything. Most critically, the extra warmth causes more water to evaporate from the oceans. But does the water hang around and increase the height of moist air in the atmosphere, or does it simply create more clouds and rain? Back in 1980, when the carbon dioxide theory started, no one knew. The alarmists guessed that it would increase the height of moist air around the planet, which would warm the planet even further, because the moist air is also a greenhouse gas. This is the core idea of every official climate model: For each bit of warming due to carbon dioxide, they claim it ends up causing three bits of warming due to the extra moist air. The climate models amplify the carbon dioxide warming by a factor of three — so two-thirds of their projected warming is due to extra moist air (and other factors); only one-third is due to extra carbon dioxide.
That’s the core of the issue. All the disagreements and misunderstandings spring from this. The alarmist case is based on this guess about moisture in the atmosphere, and there is simply no evidence for the amplification that is at the core of their alarmism.
Weather balloons had been measuring the atmosphere since the 1960s, many thousands of them every year. The climate models all predict that as the planet warms, a hot spot of moist air will develop over the tropics about 10 kilometres up, as the layer of moist air expands upwards into the cool dry air above. During the warming of the late 1970s, ’80s and ’90s, the weather balloons found no hot spot. None at all. Not even a small one. This evidence proves that the climate models are fundamentally flawed, that they greatly overestimate the temperature increases due to carbon dioxide.
This evidence first became clear around the mid-1990s.
At this point, official “climate science” stopped being a science. In science, empirical evidence always trumps theory, no matter how much you are in love with the theory. If theory and evidence disagree, real scientists scrap the theory. But official climate science ignored the crucial weather balloon evidence, and other subsequent evidence that backs it up, and instead clung to their carbon dioxide theory — that just happens to keep them in well-paying jobs with lavish research grants, and gives great political power to their government masters.


Climate models go cold | FP Comment | Financial Post
 
Hot
Warm
Cold
Warm
Hot

The earth doesn't give a shit about theories. It dose what it wants and has always done. The earth doesn't give a rats ass about humans. We are a blip on its face and nothing more.

Hot
Warm
Cold
Warm
Hot

carry on.
 
My guess is all the same idiots will make all the same posts, totally miss the point of the linked article, and continue to believe the hype. Anyone want to bat money on it?
Climate models go cold | FP Comment | Financial Post
From your link:

Global temperature is also measured by satellites, which measure nearly the whole planet 24/7 without bias. The satellites say the hottest recent year was 1998, and that since 2001 the global temperature has levelled off. Why does official science track only the surface thermometer results and not mention the satellite results?

A better question is why are deniers such pathological liars?

Below is the satellite data collected by deniers Spencer and Christy at the University of Alabama, Huntsville. Notice the decade from 2001 to 2010 is [FONT=arial, verdana, helvetica]+.14°C, not level, and that's even after the deniers changed their standard to lower the anomalies by .1[/FONT][FONT=arial, verdana, helvetica]°[/FONT][FONT=arial, verdana, helvetica]C!!!!!!!![/FONT]

[FONT=arial, verdana, helvetica][FONT=arial, verdana, helvetica]UAH MSU [/FONT][/FONT]
[FONT=arial, verdana, helvetica][FONT=arial, verdana, helvetica]TAKE NOTE: From Update 13 Sep 2010 *************************

As an alert, we will be generating anomalies when the December data have been processed to be based on the 30-year mean annual cycle of 1981-2010 to match the 30-year normal time frame of many meteorology anomalies. This will replace the older reference annual cycle of 20-years (1979-1998).
[/FONT]
[/FONT]
[FONT=arial, verdana, helvetica][FONT=arial, verdana, helvetica]From Update 8 Dec 2010 ************************* [/FONT][/FONT]
[FONT=arial, verdana, helvetica][FONT=arial, verdana, helvetica]Preliminary runs show that the new mean annual cycle will be about 0.1 C warmer each month for the global averages, meaning all monthly anomalies will appear to decrease by about 0.1 when the new 30-year base period is used (see below).

... End update
[/FONT]
[/FONT]
[FONT=arial, verdana, helvetica][FONT=arial, verdana, helvetica][/FONT][/FONT]
[FONT=arial, verdana, helvetica]Temperature Variation From Average:
Lower Troposphere:
Global:
[FONT=arial, verdana, helvetica]March 2011: -0.10 °C[/FONT]

Northern Hemisphere: -0.07 °C
Southern Hemisphere: -0.13 °C
[/FONT]
[FONT=arial, verdana, helvetica]Peak recorded anomaly:
February, 1998: +0.66 °C
Current relative to peak recorded: -0.76 °C
[/FONT]
[FONT=arial, verdana, helvetica]DECADAL TREND:
Global: +0.14 °C
Northern Hemisphere: +0.20 °C
Southern Hemisphere: +0.07 °C
[/FONT]
 
My guess is all the same idiots will make all the same posts, totally miss the point of the linked article, and continue to believe the hype. Anyone want to bat money on it?
Climate models go cold | FP Comment | Financial Post
From your link:

Global temperature is also measured by satellites, which measure nearly the whole planet 24/7 without bias. The satellites say the hottest recent year was 1998, and that since 2001 the global temperature has levelled off. Why does official science track only the surface thermometer results and not mention the satellite results?
A better question is why are deniers such pathological liars?

Below is the satellite data collected by deniers Spencer and Christy at the University of Alabama, Huntsville. Notice the decade from 2001 to 2010 is [FONT=arial, verdana, helvetica]+.14°C, not level, and that's even after the deniers changed their standard to lower the anomalies by .1[/FONT][FONT=arial, verdana, helvetica]°[/FONT][FONT=arial, verdana, helvetica]C!!!!!!!![/FONT]

[FONT=arial, verdana, helvetica][FONT=arial, verdana, helvetica]UAH MSU [/FONT][/FONT]
[FONT=arial, verdana, helvetica][FONT=arial, verdana, helvetica]TAKE NOTE: From Update 13 Sep 2010 *************************

As an alert, we will be generating anomalies when the December data have been processed to be based on the 30-year mean annual cycle of 1981-2010 to match the 30-year normal time frame of many meteorology anomalies. This will replace the older reference annual cycle of 20-years (1979-1998).
[/FONT]
[/FONT]
[FONT=arial, verdana, helvetica][FONT=arial, verdana, helvetica]From Update 8 Dec 2010 ************************* [/FONT][/FONT]
[FONT=arial, verdana, helvetica][FONT=arial, verdana, helvetica]Preliminary runs show that the new mean annual cycle will be about 0.1 C warmer each month for the global averages, meaning all monthly anomalies will appear to decrease by about 0.1 when the new 30-year base period is used (see below).

... End update
[/FONT]
[/FONT]

[FONT=arial, verdana, helvetica]Temperature Variation From Average:
Lower Troposphere:
Global:
[FONT=arial, verdana, helvetica]March 2011: -0.10 °C[/FONT]

Northern Hemisphere: -0.07 °C
Southern Hemisphere: -0.13 °C
[/FONT]
[FONT=arial, verdana, helvetica]Peak recorded anomaly:
February, 1998: +0.66 °C
Current relative to peak recorded: -0.76 °C
[/FONT]
[FONT=arial, verdana, helvetica]DECADAL TREND:
Global: +0.14 °C
Northern Hemisphere: +0.20 °C
Southern Hemisphere: +0.07 °C
[/FONT]

There are times I hate being right.

What were the sat temps before 2001?
 
Last edited:
Yet the glaciers and ice caps continue to melt. And, in spite of the strongest La Nina in forty years, the best the anamoly could do was -0.1. In fact, the lowest point of the running mean for 2011 looks like it will be higher than any high point prior to 1998.
 
Yet the glaciers and ice caps continue to melt. And, in spite of the strongest La Nina in forty years, the best the anamoly could do was -0.1. In fact, the lowest point of the running mean for 2011 looks like it will be higher than any high point prior to 1998.


You never will get this will you. The earth doesn't care if it climate is a nice warm place for humans to live in.

Hot, Warm, Cold.
 
Yet the glaciers and ice caps continue to melt. And, in spite of the strongest La Nina in forty years, the best the anamoly could do was -0.1. In fact, the lowest point of the running mean for 2011 looks like it will be higher than any high point prior to 1998.

Didn't you say that last year? And the year before?
 
My guess is all the same idiots will make all the same posts, totally miss the point of the linked article, and continue to believe the hype. Anyone want to bat money on it?
Climate models go cold | FP Comment | Financial Post
From your link:

Global temperature is also measured by satellites, which measure nearly the whole planet 24/7 without bias. The satellites say the hottest recent year was 1998, and that since 2001 the global temperature has levelled off. Why does official science track only the surface thermometer results and not mention the satellite results?
A better question is why are deniers such pathological liars?

Below is the satellite data collected by deniers Spencer and Christy at the University of Alabama, Huntsville. Notice the decade from 2001 to 2010 is [FONT=arial, verdana, helvetica]+.14°C, not level, and that's even after the deniers changed their standard to lower the anomalies by .1[/FONT][FONT=arial, verdana, helvetica]°[/FONT][FONT=arial, verdana, helvetica]C!!!!!!!![/FONT]

[FONT=arial, verdana, helvetica][FONT=arial, verdana, helvetica]UAH MSU [/FONT][/FONT]
[FONT=arial, verdana, helvetica][FONT=arial, verdana, helvetica]TAKE NOTE: From Update 13 Sep 2010 *************************

As an alert, we will be generating anomalies when the December data have been processed to be based on the 30-year mean annual cycle of 1981-2010 to match the 30-year normal time frame of many meteorology anomalies. This will replace the older reference annual cycle of 20-years (1979-1998).
[/FONT]
[/FONT]
[FONT=arial, verdana, helvetica][FONT=arial, verdana, helvetica]From Update 8 Dec 2010 ************************* [/FONT][/FONT]
[FONT=arial, verdana, helvetica][FONT=arial, verdana, helvetica]Preliminary runs show that the new mean annual cycle will be about 0.1 C warmer each month for the global averages, meaning all monthly anomalies will appear to decrease by about 0.1 when the new 30-year base period is used (see below).

... End update
[/FONT]
[/FONT]

[FONT=arial, verdana, helvetica]Temperature Variation From Average:
Lower Troposphere:
Global:
[FONT=arial, verdana, helvetica]March 2011: -0.10 °C[/FONT]

Northern Hemisphere: -0.07 °C
Southern Hemisphere: -0.13 °C
[/FONT]
[FONT=arial, verdana, helvetica]Peak recorded anomaly:
February, 1998: +0.66 °C
Current relative to peak recorded: -0.76 °C
[/FONT]
[FONT=arial, verdana, helvetica]DECADAL TREND:
Global: +0.14 °C
Northern Hemisphere: +0.20 °C
Southern Hemisphere: +0.07 °C
[/FONT]

There are times I hate being right.

What were the sat temps before 2001?
[FONT=arial, verdana, helvetica]Colder.[/FONT] The trend from 1979, when satellite measurement began, gives a trend of +0.131°C/decade. That means that each decade was WARMER than the previous decade by +0.131°C, so there was no leveling off since 2001 as the liar you linked to claimed.
 
Last edited:
My guess is all the same idiots will make all the same posts, totally miss the point of the linked article, and continue to believe the hype. Anyone want to bat money on it?
Climate models go cold | FP Comment | Financial Post
From your link:

Global temperature is also measured by satellites, which measure nearly the whole planet 24/7 without bias. The satellites say the hottest recent year was 1998, and that since 2001 the global temperature has levelled off. Why does official science track only the surface thermometer results and not mention the satellite results?

A better question is why are deniers such pathological liars?

Below is the satellite data collected by deniers Spencer and Christy at the University of Alabama, Huntsville. Notice the decade from 2001 to 2010 is [FONT=arial, verdana, helvetica]+.14°C, not level, and that's even after the deniers changed their standard to lower the anomalies by .1[/FONT][FONT=arial, verdana, helvetica]°[/FONT][FONT=arial, verdana, helvetica]C!!!!!!!![/FONT]

[FONT=arial, verdana, helvetica][FONT=arial, verdana, helvetica]UAH MSU [/FONT][/FONT]
[FONT=arial, verdana, helvetica][FONT=arial, verdana, helvetica]TAKE NOTE: From Update 13 Sep 2010 *************************

As an alert, we will be generating anomalies when the December data have been processed to be based on the 30-year mean annual cycle of 1981-2010 to match the 30-year normal time frame of many meteorology anomalies. This will replace the older reference annual cycle of 20-years (1979-1998).
[/FONT]
[/FONT]
[FONT=arial, verdana, helvetica][FONT=arial, verdana, helvetica]From Update 8 Dec 2010 ************************* [/FONT][/FONT]
[FONT=arial, verdana, helvetica][FONT=arial, verdana, helvetica]Preliminary runs show that the new mean annual cycle will be about 0.1 C warmer each month for the global averages, meaning all monthly anomalies will appear to decrease by about 0.1 when the new 30-year base period is used (see below).

... End update
[/FONT]
[/FONT]
[FONT=arial, verdana, helvetica][FONT=arial, verdana, helvetica][/FONT][/FONT]
[FONT=arial, verdana, helvetica]Temperature Variation From Average:
Lower Troposphere:
Global:
[FONT=arial, verdana, helvetica]March 2011: -0.10 °C[/FONT]

Northern Hemisphere: -0.07 °C
Southern Hemisphere: -0.13 °C
[/FONT]
[FONT=arial, verdana, helvetica]Peak recorded anomaly:
February, 1998: +0.66 °C
Current relative to peak recorded: -0.76 °C
[/FONT]
[FONT=arial, verdana, helvetica]DECADAL TREND:
Global: +0.14 °C
Northern Hemisphere: +0.20 °C
Southern Hemisphere: +0.07 °C
[/FONT]


Seems that the area with the best temperature recording capability disagrees with that assesment. Even the warmists have to admit the US has seen no warming.

A look at mid tropospheric temps vs the lower level temps reveals that globally, the atmosphere is more unstable because of the deep level cooling that has taken place! Its that simple. The cooling in the low levels has not yet caught up to what is going on aloft, and because of that, the way to balance that out is in the form of more atmospheric fights.

http://www.weatherbell.com/jb/?p=1749

Gore, Greenpeace, and the “consensus of scientists” tell us that global warming endangers agriculture and global food security. A study published last week in Science magazine finds global warming has taken significant bites out of potential global corn and wheat production since 1980.

The study also finds, however, that climate change has not adversely affected U.S. corn and wheat production. How so – because of Yankee ingenuity? Not according to the study. The explanation, rather, is that America has been a “notable exception” to climate change. The USA “experienced a slight cooling” during the study period (1980-2008).

This is bizarre. Here we have an alarmist study that finds a “lack of significant climate trends” in the USA for the past 30 years. If true, that makes hash out of all those dire pronouncements by Gore and others that global warming is already contributing to hurricanes, tornadoes, snow storms, forest fires, floods, etc. in the USA. Are the study’s authors aware of this implication? Are the editors of Science? Apparently not.

How do the authors know that climate change is depressing corn and wheat production globally, even if not in the USA? The biggest loss in wheat production, according to the study, is in Russia. Do they adjust Russian crop yields for the Russian economic meltown and financial crisis of the 1990s? As far as I can tell, they don’t. I would not bet the farm on the validity of this study.

Published last Friday in Science magazine, Climate Trends and Global Crop Production Since 1980 estimates that, had global temperatures remained at the 1960-1980 average, global corn and wheat yields would have been 3.8% and 5.5% higher during 1980 to 2008.

The study is getting plenty of buzz on the Web. “Climate change shrinks global crop yields, study finds” - Care2.Com. “Global warming already affecting crop yields” - SustainableBusiness.Com. “Crop yields fall as temperatures rise” – New Scientist. “Study: climate change cuts into global crop yields” – DeMoinesRegister.Com. ”Cereal killer: Climate change stunts growth of global crop yields” – Scientific American.


http://www.globalwarming.org/2011/0...natural-variability-alarmist-study-finds-huh/
 
Last edited:
My guess is all the same idiots will make all the same posts, totally miss the point of the linked article, and continue to believe the hype. Anyone want to bat money on it?
Climate models go cold | FP Comment | Financial Post
From your link:

Global temperature is also measured by satellites, which measure nearly the whole planet 24/7 without bias. The satellites say the hottest recent year was 1998, and that since 2001 the global temperature has levelled off. Why does official science track only the surface thermometer results and not mention the satellite results?
A better question is why are deniers such pathological liars?

Below is the satellite data collected by deniers Spencer and Christy at the University of Alabama, Huntsville. Notice the decade from 2001 to 2010 is [FONT=arial, verdana, helvetica]+.14°C, not level, and that's even after the deniers changed their standard to lower the anomalies by .1[/FONT][FONT=arial, verdana, helvetica]°[/FONT][FONT=arial, verdana, helvetica]C!!!!!!!![/FONT]

[FONT=arial, verdana, helvetica][FONT=arial, verdana, helvetica]UAH MSU [/FONT][/FONT]
[FONT=arial, verdana, helvetica][FONT=arial, verdana, helvetica]TAKE NOTE: From Update 13 Sep 2010 *************************

As an alert, we will be generating anomalies when the December data have been processed to be based on the 30-year mean annual cycle of 1981-2010 to match the 30-year normal time frame of many meteorology anomalies. This will replace the older reference annual cycle of 20-years (1979-1998).
[/FONT]
[/FONT]
[FONT=arial, verdana, helvetica][FONT=arial, verdana, helvetica]From Update 8 Dec 2010 ************************* [/FONT][/FONT]
[FONT=arial, verdana, helvetica][FONT=arial, verdana, helvetica]Preliminary runs show that the new mean annual cycle will be about 0.1 C warmer each month for the global averages, meaning all monthly anomalies will appear to decrease by about 0.1 when the new 30-year base period is used (see below).

... End update
[/FONT]
[/FONT]

[FONT=arial, verdana, helvetica]Temperature Variation From Average:
Lower Troposphere:
Global:
[FONT=arial, verdana, helvetica]March 2011: -0.10 °C[/FONT]

Northern Hemisphere: -0.07 °C
Southern Hemisphere: -0.13 °C
[/FONT]
[FONT=arial, verdana, helvetica]Peak recorded anomaly:
February, 1998: +0.66 °C
Current relative to peak recorded: -0.76 °C
[/FONT]
[FONT=arial, verdana, helvetica]DECADAL TREND:
Global: +0.14 °C
Northern Hemisphere: +0.20 °C
Southern Hemisphere: +0.07 °C
[/FONT]

Seems that the area with the best temperature recording capability disagrees with that assesment. Even the warmists have to admit the US has seen no warming.

A look at mid tropospheric temps vs the lower level temps reveals that globally, the atmosphere is more unstable because of the deep level cooling that has taken place! Its that simple. The cooling in the low levels has not yet caught up to what is going on aloft, and because of that, the way to balance that out is in the form of more atmospheric fights.
And there we see the deniers move the goalposts once their lies are exposed.

The OP's link was talking about GLOBAL temps and how SATELLITES read nearly the whole globe WITHOUT BIAS, and now suddenly it's the US and not the globe that has seen no warming, and only that US data is accurate because the US has the best GROUND station capabilities. :cuckoo:

And as I predicted way back when deniers Christy and Spencer were cooking the lower troposphere satellite data by using the wrong sign to correct for diurnal satellite drift, that as soon as the lower troposphere data no longer supported their global cooling claims, the deniers would move away from using the lower troposphere to the mid and/or upper troposphere.

The rest of your post is a feeble attempt to divert the thread. FAIL!
 
Last edited:
"BBC: Do you agree that from 1995 to the present there has been no statistically-significant global warming

Phil Jones: Yes..."
 
"BBC: Do you agree that from 1995 to the present there has been no statistically-significant global warming

Phil Jones: Yes..."
I've lost track of how many times I've caught CF posting this deliberate deception on other threads and the only change he's made is to add the ellipsis. But it does serve to show the complete dishonesty of CONS, so thank you CF.

First of all, CF gives no link because he knows that if you see the whole quote you will see his obvious attempt at deception by taking the much less than half quote completely out of context. The context of the quote was not that there was no global warming during the period, but that the time period was just a tiny bit too short for the MEASURED WARMING of +.12C to be "statistically-significant!" So the warming was statistically-significant but the time period wasn't!!!!!

Of course, this exposing your premeditated lie will not stop you from posting the same lie in another trhread, after all, you ARE a CON$ervative.

BBC News - Q&A: Professor Phil Jones

BBC - Do you agree that from 1995 to the present there has been no statistically-significant global warming


Phil Jones: Yes, but only just. I also calculated the trend for the period 1995 to 2009. This trend (0.12C per decade) is positive, but not significant at the 95% significance level. The positive trend is quite close to the significance level. Achieving statistical significance in scientific terms is much more likely for longer periods, and much less likely for shorter periods.
 
Yet the glaciers and ice caps continue to melt. And, in spite of the strongest La Nina in forty years, the best the anamoly could do was -0.1. In fact, the lowest point of the running mean for 2011 looks like it will be higher than any high point prior to 1998.

The glaciers have been melting for some 14,000 years now. They have melted back nearly 2,000 miles in some places. Again, what exactly do you find distressing, or unusual in the fact that nature's trend for the past 14,000 years continues; and what the hell do you believe we can do about it?
 
"BBC: Do you agree that from 1995 to the present there has been no statistically-significant global warming

Phil Jones: Yes..."
I've lost track of how many times I've caught CF posting this deliberate deception on other threads and the only change he's made is to add the ellipsis. But it does serve to show the complete dishonesty of CONS, so thank you CF.

First of all, CF gives no link because he knows that if you see the whole quote you will see his obvious attempt at deception by taking the much less than half quote completely out of context. The context of the quote was not that there was no global warming during the period, but that the time period was just a tiny bit too short for the MEASURED WARMING of +.12C to be "statistically-significant!" So the warming was statistically-significant but the time period wasn't!!!!!

Of course, this exposing your premeditated lie will not stop you from posting the same lie in another trhread, after all, you ARE a CON$ervative.

BBC News - Q&A: Professor Phil Jones

BBC - Do you agree that from 1995 to the present there has been no statistically-significant global warming


Phil Jones: Yes, but only just. I also calculated the trend for the period 1995 to 2009. This trend (0.12C per decade) is positive, but not significant at the 95% significance level. The positive trend is quite close to the significance level. Achieving statistical significance in scientific terms is much more likely for longer periods, and much less likely for shorter periods.

the whole answer is what we like to call hedging. "quite close to significance level" is sci-speak for not out of the margin of error.

My issues with the whole global temperature debate are as follows:

The various methods of measuring temperature, as well as the various methods use to "smooth" the data.
The fact we only have reliable temperature data (limited earlier on) for the past 200 years or so. Everything before that is inferred, or from less accurate direct measurement methods.
The complexity of the models, as the OP's post discusses. There are simply too many "ins and outs" for me to trust these models to the level required to radically change our society.
The short period we are discussing as the problem. Even if we were influencing the climate natural variations could have such an effect to drown out any changes we make.
 
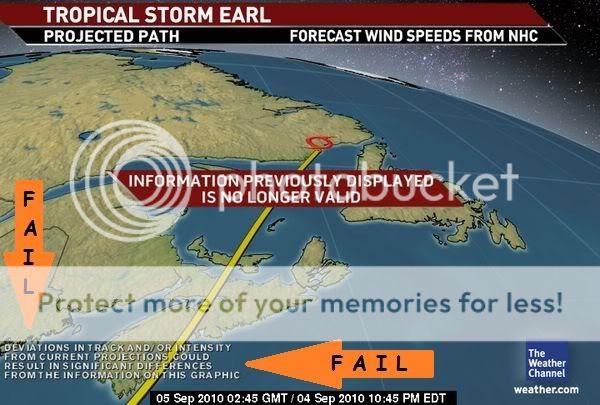
Computer models!!!!!!!!!!!!!!!:rofl::rofl::rofl:

They need to make a Geico commercial about this:lol:


"Will switching to Geico save you 15% or more on car insurance??"

"Are computer models always wrong??"


map_tropprjpath07_ltst_5nhato_enus_600x405-1.jpg


Ooooooooooooooooooooops!!!!!!!!!!!!!!


Great-Pumpkin-Charlie-Brown-1024.jpg
 
Last edited:
"BBC: Do you agree that from 1995 to the present there has been no statistically-significant global warming

Phil Jones: Yes..."
I've lost track of how many times I've caught CF posting this deliberate deception on other threads and the only change he's made is to add the ellipsis. But it does serve to show the complete dishonesty of CONS, so thank you CF.

First of all, CF gives no link because he knows that if you see the whole quote you will see his obvious attempt at deception by taking the much less than half quote completely out of context. The context of the quote was not that there was no global warming during the period, but that the time period was just a tiny bit too short for the MEASURED WARMING of +.12C to be "statistically-significant!" So the warming was statistically-significant but the time period wasn't!!!!!

Of course, this exposing your premeditated lie will not stop you from posting the same lie in another trhread, after all, you ARE a CON$ervative.

BBC News - Q&A: Professor Phil Jones

BBC - Do you agree that from 1995 to the present there has been no statistically-significant global warming


Phil Jones: Yes, but only just. I also calculated the trend for the period 1995 to 2009. This trend (0.12C per decade) is positive, but not significant at the 95% significance level. The positive trend is quite close to the significance level. Achieving statistical significance in scientific terms is much more likely for longer periods, and much less likely for shorter periods.

the whole answer is what we like to call hedging. "quite close to significance level" is sci-speak for not out of the margin of error.

My issues with the whole global temperature debate are as follows:

The various methods of measuring temperature, as well as the various methods use to "smooth" the data.
The fact we only have reliable temperature data (limited earlier on) for the past 200 years or so. Everything before that is inferred, or from less accurate direct measurement methods.
The complexity of the models, as the OP's post discusses. There are simply too many "ins and outs" for me to trust these models to the level required to radically change our society.
The short period we are discussing as the problem. Even if we were influencing the climate natural variations could have such an effect to drown out any changes we make.
You may like to call it hedging, but that does not make it so. And it is "sci-speak" for exactly what it says, longer periods of time are more significant.

My issues with the deniers "debate" is if the deniers really have the problems you point out, then why do they lie about the global temps being level since 2001, like the link the OP used when they have been rising or the deliberately misleading way they quoted Jones in an earlier post, and why YOU seem to have no issue with that?!!! To me that kind of deception says the deniers know the facts are not on their side so they have to at least create doubt by any means possible!!!
 
Yet the glaciers and ice caps continue to melt. And, in spite of the strongest La Nina in forty years, the best the anamoly could do was -0.1. In fact, the lowest point of the running mean for 2011 looks like it will be higher than any high point prior to 1998.


You never will get this will you. The earth doesn't care if it climate is a nice warm place for humans to live in.

Hot, Warm, Cold.

And a silly ass like you cannot fathom that it is us that is creating this change. And the danger is not that the planet does not care about the conditons that the human race has to face, but rather, that the human race is short sighted enough that it does not care what our descendents face. And, judging from what is going on right now, that is the case.
 

Forum List

Back
Top