Climate Basics

I have no problem with inaccuracies with temperature data ... the lack of thermometers is a well established problem with the published "average global temperature" ... the important part is that these averages are calculated using the same method for each year ... so that these inaccuracies are common to all the data points ... I think the word "derived" in the OP is poorly chosen, we can derive the ideal temperature (4ºC for emissivity = 1), otherwise we're just estimating and include all the normal safeguards when using statistics ... especially with averages that carry a rather large standard deviation ...

We can calculate the average annual temperatures for just one location easy enough ... overlay the surface analysis and calculate the gradients for a regional area ... I think it's a mistake to believe these numbers are going to be any more accurate than instrumentation error (+/- 0.5ºC) ...

gfm7175 said "Earth's emissivity is unknown" -- I was wondering why I couldn't find this information, not that my Google-fu is any good ... that's a pretty serious hole in the carbon dioxide portion of AGW theory ... seriously, just how hard is it to shine light on a gas and measure the temperature rise? ...
 
As far as statistics, you do not have the data to compute anything. Even with statistics you need some basis of actual data, you do not have it.

Because you say so?

Impressive. I'm sure all the statistical experts who disagree with you with instantly reverse themselves, given that you've given us such convincing data.

I've seen the statistics run. I've seen that as few as a 100 data points gets you a very good temperature average. I've seen that removing 90% of the data results in know change. Statistics-wise, the temperature network is quite adequate for the task.
It depends on what data you begin with. If you start with garbage data all the statistics, modelling, algorithms are worthless. You do not have the data to begin with. The statistical analyses of garbage data will give you garbage.

As far as average temp, for what? That was my earlier point. Give me the temp in 100 cities in the US, it's meaningless. A statistical analyse of that data is meaningless. Are those 100 temp readings from within urban heat islands? Are they representative of the surrounding areas? Are those readings over representative of specific areas? Do those readings offer a solid representation for a larger area? Statistics are useful but only where you have useful data to begin with.

According to the averages...the average temperature of everywhere is warming twice as fast as the average temperature of the globe..

Alarmism Exposed: The entire world is warming faster than the entire planet
 
Not a measurement of absolute temperature.

Where'd you get THIS from?? Are U asserting that thermometers and Adv. Microwave scanning thermometers on satellites are just junk science???

Not even reading the rest if all you're gonna do is slimy negativism with no explanation. I work too hard on my posts here to react to that...
 
Satellites do NOT measure absolute temperatures. They measure light. In order to convert those light readings into temperature readings, the emissivity of Earth MUST be known. We do not know the emissivity of Earth, therefore this cannot be done. Satellites are great for looking at relative temperatures, but not for absolute temperatures of anything other than the satellite itself.

You're simply wrong.. And there's no excuse for making shit up about how satellites measure temperature.. Go look up AMSU satellite measure and LEARN A BIT before you make a fool of yourself again GUESSING about how things work....
 
Can anyone explain to me how the average temperature of planet Earth is derived? And I don't want the opinion of this scientist or that scientist. I want the systems, networks and data points. I ask because as of this point I'm appalled by that what is commonly referred to. I'm particularly interested in how current data is compared to past data.
By some supposedly "authoritative source" inputting random numbers into a computer that merely spits out more random numbers which get put onto a pretty looking "authoritative" chart/graph supposedly making reference to some "anomaly", but never is it described what exactly is being measured in an "anomaly"...

In other words, these twits are completely full of shit. The average temperature of Earth has never been accurately derived in any way/shape/form. We simply do not have enough thermometers to do so.

Even IF all thermometers were uniformly spaced and simultaneously read by the same observer (they aren't, but for argument's sake, let's say they are), Earth has some 197 million sq miles of surface area. NASA only makes use of some 7,500 thermometers. That equates to ONE thermometer for every 26,266 sq miles of surface area, or an area about the size of the entire State of West Virginia. Do you think that one single thermometer can accurately measure the temperature for the whole State of West Virginia?? I've personally observed temperature variances as high as 20degF per MILE in my State of Wisconsin... So yeah, not nearly enough thermometers... The margin of error is far too great.

We would need 200 million thermometers to even BEGIN such a statistical analysis...
The Michael Mann correction vector;
Mann Correction Vector.JPG
 
That's idiocy. So if the 100 cities were in Alabama and Mississippi you would consider this sufficiently representative of the continental US?

No, but you didn't say that. You made it sound like they were random cities.

What if they were in Montana and North Dakota? Still representative of The continental US? Idiocy.

And as it's purely your idiocy, don't ask me to justify it.

And you compare this to what from 1922? We'll have to disagree on the quality of TODAY'S data, you have nothing to compare it to. Nothing. A guy with a bucket.

You are free to believe whatever nonsense makes you feel good. Just don't expect anyone else to pay attention.
You seem to miss the point. I don't care if the 100 cities are evenly spaced across the country. the variations within the geographic areas represented by individual readings are so great as to render them useless. Again, NOAA uses something like 1220 sites across the country. If evenly spaced that would leave my home area with a geographic area so large that temps regularly differ by 8-10 deg F. Sometimes more. In scientific terms that's known as shit data.
 
Can anyone explain to me how the average temperature of planet Earth is derived? And I don't want the opinion of this scientist or that scientist. I want the systems, networks and data points. I ask because as of this point I'm appalled by that what is commonly referred to. I'm particularly interested in how current data is compared to past data.
By some supposedly "authoritative source" inputting random numbers into a computer that merely spits out more random numbers which get put onto a pretty looking "authoritative" chart/graph supposedly making reference to some "anomaly", but never is it described what exactly is being measured in an "anomaly"...

In other words, these twits are completely full of shit. The average temperature of Earth has never been accurately derived in any way/shape/form. We simply do not have enough thermometers to do so.

Even IF all thermometers were uniformly spaced and simultaneously read by the same observer (they aren't, but for argument's sake, let's say they are), Earth has some 197 million sq miles of surface area. NASA only makes use of some 7,500 thermometers. That equates to ONE thermometer for every 26,266 sq miles of surface area, or an area about the size of the entire State of West Virginia. Do you think that one single thermometer can accurately measure the temperature for the whole State of West Virginia?? I've personally observed temperature variances as high as 20degF per MILE in my State of Wisconsin... So yeah, not nearly enough thermometers... The margin of error is far too great.

We would need 200 million thermometers to even BEGIN such a statistical analysis...
On top of that, if you listen to planetary scientists, surface temp is meaningless. People that study Mars, Jupiter or any other planet with an atmosphere seem to have no interest in surface temps. They are interested in the "meat" of the atmosphere. On Earth that is something like 5-7 km up.
 
You seem to miss the point. I don't care if the 100 cities are evenly spaced across the country. the variations within the geographic areas represented by individual readings are so great as to render them useless.

Your endless repetitions of "BECAUSE I SAY SO!" don't look any less dumb with repetition. We get it. You _feel_ something is true, so you feel no need to look further. You need to understand that you're dealing with reality-based people. We require evidence, and you have none.

Again, NOAA uses something like 1220 sites across the country. If evenly spaced that would leave my home area with a geographic area so large that temps regularly differ by 8-10 deg F.

But the anomalies don't, so your conspiracy theory faceplants hard.

Sometimes more. In scientific terms that's known as shit data.

If look up Dunning-Kruger Syndrome, you'll find your picture next to it as an example. You know so little about the topic, you're blissfully unaware of how little you know.
 
Last edited:
Where'd you get THIS from?? Are U asserting that thermometers and Adv. Microwave scanning thermometers on satellites are just junk science??

Thermometers on satellites?

Do tell us, how do those measure the temperature on the earth?

The microwave scanners get their output fed into models with multiple fudge factors, which then spit out a modeled temperature. The fudge factors seem to get changed regularly, especially with UAH. That's why Dr. Mears of RSS cautions to not use satellite model temps over surface temps. Satellite temps are a scientific curiosity, a work in progress, as opposed to reliable hard data like the surface temps.
 
You seem to miss the point. I don't care if the 100 cities are evenly spaced across the country. the variations within the geographic areas represented by individual readings are so great as to render them useless.

Your endless repetitions of "BECAUSE I SAY SO!" don't look any less dumb with repetition. We get it. You _feel_ something is true, so you feel no need to look further. You need to understand that you're dealing with reality-based people. We require evidence, and you have none.

Again, NOAA uses something like 1220 sites across the country. If evenly spaced that would leave my home area with a geographic area so large that temps regularly differ by 8-10 deg F.

But the anomalies don't, so your conspiracy theory faceplants hard.

Sometimes more. In scientific terms that's known as shit data.

If look up Dunning-Kruger Syndrome, you'll find your picture next to it as an example. You know so little about the topic, you're blissfully unaware of how little you know.
What is it with you and the word "anomaly"? Explain what this has to do with anything.


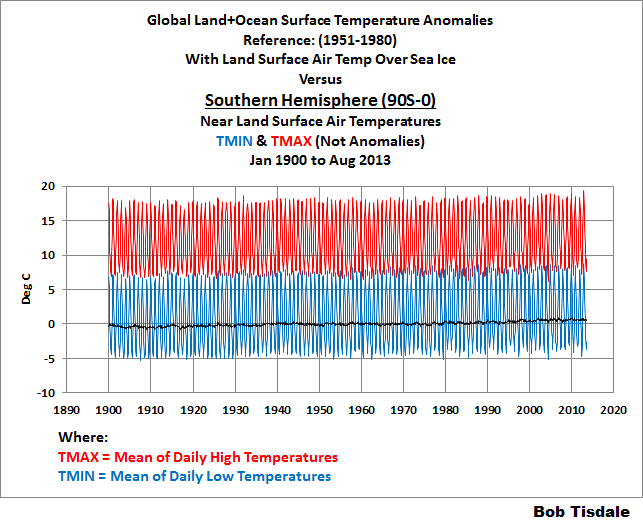
Anomaly is a bit of slight of hand...or misdirection that climate science uses in an attempt to fool people...They show temperature in terms of anomaly in order to create a sense of urgency...to create the illusion of crisis...to fool people who don't realize that they are being fooled..

Here is a typical temperature graph shown in terms of anomaly: Pretty scary huh...looks like we are really causing some problems there...graphs like that get people's attention and starts their imagination working.

image_preview


Now here is the same data shown in terms of actual temperature: Ho hum...right? Nothing scary going on there. If I tried to get you worked up into a climate change frenzy where you might actually be willing to give up some of your freedom in order to avert the coming catastrophe...there isn't much chance of that happening if I show you the graph below, is there?

figure-31.png
figure-41.png


It would be pretty hard to convince anyone..even useful idiots of impending climate catastrophe if they showed the actual temperature rather than the false scales associated with showing temperatures in terms of anomoly.
 
Here is a typical temperature graph shown in terms of anomaly:

We've seen your "Let's rig the scaling to hide the data!" scam before. It doesn't get any less stupid and dishonest with repetition. It's the exclusive tactic of cult fraudsters like you and Billy, and seeing it is an indication that the one pushing it should never be taken seriously on any topic.
 
What is it with you and the word "anomaly"? Explain what this has to do with anything.

Anomalies are used for temperature trend calculation.

Anomalies are very smooth over ranges of hundreds of miles, so extrapolation is nearly perfect.

Hence, your "there aren't enough stations" argument faceplants, and you have no argument.

As there is a limit to how far this topic can be dumbed down, you may not be capable of understanding that.
 
As far as statistics, you do not have the data to compute anything. Even with statistics you need some basis of actual data, you do not have it.

Because you say so?

Impressive. I'm sure all the statistical experts who disagree with you with instantly reverse themselves, given that you've given us such convincing data.

I've seen the statistics run. I've seen that as few as a 100 data points gets you a very good temperature average. I've seen that removing 90% of the data results in know change. Statistics-wise, the temperature network is quite adequate for the task.
It depends on what data you begin with. If you start with garbage data all the statistics, modelling, algorithms are worthless. You do not have the data to begin with. The statistical analyses of garbage data will give you garbage.

As far as average temp, for what? That was my earlier point. Give me the temp in 100 cities in the US, it's meaningless. A statistical analyse of that data is meaningless. Are those 100 temp readings from within urban heat islands? Are they representative of the surrounding areas? Are those readings over representative of specific areas? Do those readings offer a solid representation for a larger area? Statistics are useful but only where you have useful data to begin with.

According to the averages...the average temperature of everywhere is warming twice as fast as the average temperature of the globe..

Alarmism Exposed: The entire world is warming faster than the entire planet
Ahhhh, so you've noticed this problem too?? ;)

Yeah, just do a quick Google search... It's quite hilarious... Then I also did searches for "cooling twice as fast", "warming half as fast", and "warming slower than", and couldn't get any results pertaining to the 'global average'... But search for "warming twice as fast" and holy crap various countries pop up left and right as all 'warming twice as fast' as the "global average"... So which ones are the cooler ones then?? Silly LMS Deniers...
 
Not a measurement of absolute temperature.

Where'd you get THIS from?? Are U asserting that thermometers and Adv. Microwave scanning thermometers on satellites are just junk science???

Not even reading the rest if all you're gonna do is slimy negativism with no explanation. I work too hard on my posts here to react to that...
I explained further down... you know, the part you didn't read through...

I'm not saying that thermometers are junk. I'm saying that they are not measuring what you think they are measuring. A thermometer on a satellite can only measure the temperature of the satellite. It cannot measure the temperature of Earth. Satellites are not magick. What satellites measure is light, not absolute temperature. That light reading would then need to be converted into a temperature reading via the Stefan Boltzmann Law, but the issue there is that we do not know the emissivity of Earth. In order to know that, we first need to know the temperature of Earth, which is what we are attempting to measure in the first place.
 
Satellites do NOT measure absolute temperatures. They measure light. In order to convert those light readings into temperature readings, the emissivity of Earth MUST be known. We do not know the emissivity of Earth, therefore this cannot be done. Satellites are great for looking at relative temperatures, but not for absolute temperatures of anything other than the satellite itself.

You're simply wrong.. And there's no excuse for making shit up about how satellites measure temperature.. Go look up AMSU satellite measure and LEARN A BIT before you make a fool of yourself again GUESSING about how things work....
Like I said, satellites are not magick.
 
A thermometer on a satellite can only measure the temperature of the satellite.

No PLEASE -- stop RIGHT THERE and go and LEARN something like I suggested.. No effort = zero cred when it comes to physics and science.. You can BELIEVE anything ya want.. But making stupid assertions like that are just gonna embarrass you...

GO look up AMSU satellite measuring package...
 
Anomalies are used for temperature trend calculation.
Actually; Anomalies are used to HIDE actual temperature trends or make them more scary to forward the liberal control agenda..

Anomaly representations are simple "normalizations".. There's little room to flub with things. Unless you CHANGE the period of "normalizing data epoch" in a way where the current calculated anomalies can not be directly compared to OTHER GMASTemperature results..

For instance, the sat record only exists from about 1979, so they use the whole period from the beginning to today to create a mean that gets subtracted from the actual temperature.. While the land based records USED TO USE the past 30 years as the normalizing mean.. But now, they've switched to the entire 20th century which produces larger but more representative anomaly magnitudes...
 
Here is a typical temperature graph shown in terms of anomaly:

We've seen your "Let's rig the scaling to hide the data!" scam before. It doesn't get any less stupid and dishonest with repetition. It's the exclusive tactic of cult fraudsters like you and Billy, and seeing it is an indication that the one pushing it should never be taken seriously on any topic.

There is the evidence right before your eyes hairball...next time you feel like pointing out the catastrophic warming we are experiencing, show the graphs that show temperature in terms of actual temperature and record the responses you get...
 

Forum List

Back
Top