capital "Investment" drives Recessions ?

Widdekind

Member
Mar 26, 2012
813
35
16
During downturns (David Romer. Advanced Macroeconomics, p.140),
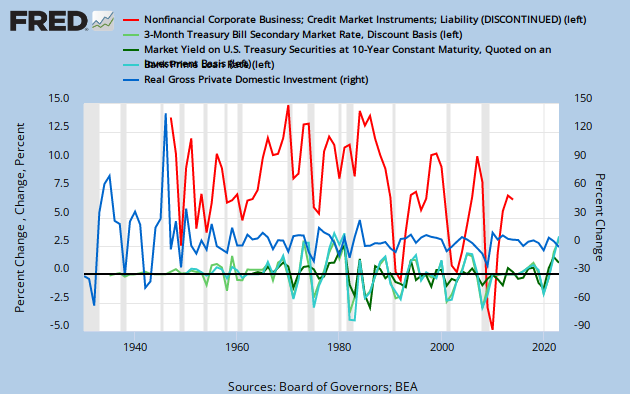
  • businesses stop borrowing (red line, growth rate (%) of corporate debt)
  • Investment expenditures plummet (blue line, growth rate (%) of real private investment (I))
  • short-term interest rates fall (solid green lines, change (%) of bank prime rate & 3-month T-bill yields)
  • long-term interest rates decline (dashed green line, change (%) of 10-year T-bill yields)
With no businesses borrowing big, lenders look to government, flooding the credit market with "supply" of loanable funds, suppressing the "price" of credit, i.e. interest rates. UE rates also rise, so the public stops borrowing from banks; the "demand" for loans decreases, again suppressing the "price" of credit. Businesses also dis-accumulate inventory, firing workers, whilst they sell off several years worth of inventory, accumulated during the preceding upswing (which is why inventory changes are indicators of recessions & recoveries). Savings (S) and Investment (I) are important in recessions & recoveries:
fredgraph.png
 
Investment (I) drives recessions; and derives from Savings (S) borrowed by businesses, through the financial system. Thus, financial markets may affect recessions:
For short-run fluctuations... disruptions to the financial system can affect investment , and thus aggregate output [real GDP]... Bernanke argues that the collapse of the US banking system in the early 1930s contributed to the severity of the Great Depression, by reducing the effectiveness of the financial system in evaluating and funding investment projects...

output fluctuations arising from other sources [besides technology] may affect the measured Solow residual... Bernanke & Parkinson estimate [that] the Solow residual may be a poor measure of technological change in the Great Depression, but not in other periods (David Romer. Advanced Macroeconomics, p.183,378)

Perhaps, for short-term fluctuations, financial factors affect the Solow residual, which otherwise tends to track technology improvements, when averaged over long-term growth ? For example, during expansions, wages rise, and public borrowing rises, so that expansions are accelerated, by borrowing (debt growth). Then, during downturns, borrowing decreases, whilst banks are repaid, contracting the money supply. Debt-fueled expansions are followed by deleveraging during downturns, perhaps explain part of short-term fluctuations in the Solow residual ?
 
Inventory accumulation is accounted as production (GDP), even though no sales revenues are generated. GDP less inventory accumulation represents "Gross Retail Sales" (GRS). According to Okun's Law, a 1% rise in the employment rate (1% fall in UE rate) tends to correlate to a 2% rise in production (real GDP).

Inventories plunge during recessions. So, GRS tends to be less volatile than GDP. During downturns, production plummets; but retail revenues are generated from sale of products produced previously, during the preceding upswing. Indeed, the employment rate (UE rate) correlates more strongly to production (real GDP), than to sales volume (real GDP less real inventory accumulation), or to sales revenue (GDP). And, that correlation is strengthened, year to year, over quarter to quarter. In the short term (quarterly), production can fall without falling employment. But in the long term (annually), falling production correlates with falling employment. Evidently, businesses can "carry people" for a quarter, but not for a year; after several successive slow quarters, businesses are forced to fire workers. Plausibly therefore, economists define "recessions" as several successive quarters of falling output. The ratio is nearly 2, per Okun's Law.

Why would a 1% increase in employment rate generate a 2% increase in output? That implies increasing worker productivity in expansions (1 more worker, 2 more widgets), and decreasing worker productivity during contractions. A modified Okun's Law, for output growth vs. change in total labor man-hours, has a ratio half as large, or nearly 1, i.e. a 1% increase in total labor hours generates a nearly 1% increase in production. So, labor use intensifies during expansions, with hours worked per worker increasing, along with the number of workers; et vice versa. Okun's Law may derive, from 1% increases in employment level & 1% increases in hours worked per employee combining to generate a 2% increase in production output, only half of which can be accounted for, by increasing employment alone ("not just more workers, but more workers working more").
 
Last edited:
"factor-hours" drive output (real GDP)

Factor-hours (total labor-hours worked, by the entire labor-force; total machine-hours of operation, of all capital equipment) correlate to production output (real GDP). Growth in factor-hours correlates to an equivalent growth in output. In the following figure, "capital-hours" is estimated from the gas & electric production index, which includes household use of utilities, and so is unsurprisingly less correlated to business production.
outputgrowthvsfactorhou.png


intensity of factor usage is pro-cyclical

During expansions, on average, workers labor longer (more hours per worker), and produce more (real GDP per employee); even while additional workers are hired (increasing E rate, decreasing UE rate). Et vice versa during recessions. When the E rate increases +1% (UE decreases -1%), total labor hours increases by +2%, i.e. more workers (+1% to work-force) are working more (+1% to hours per worker in work-force). Thus Okun's Law, according to which a +1% increase in the E rate, translates to a +2% increase in output, i.e. half from the 1% increase in the workforce; and an equal amount from intenser use of labor (1% increase in hours per worker). Inexpertly, the 2:1 ratio of Okun's Law derives from more workers (+1%) working more (+1%) producing even more (+2%). Estimated capital-hours also intensify pro-cyclically (in concert with the business cycle).
factorhourgrowthvsuerat.png
Indeed, as the E rate rises (UE rate falls) by one percent, hours per worker rises by half a percent. Rising employment, and rising "intensity of employment" (hours per year), combine to create Okun's Law.
factorusagevsuerate.png
Power usage (gas & electric utilities production) is pro-cyclical:
fredgraph.png
 
Last edited:

Forum List

Back
Top