Canadian Glaciers

Old Rocks

Diamond Member
Oct 31, 2008
63,085
9,749
2,040
Portland, Ore.
TC - Abstract - Area change of glaciers in the Canadian Rocky Mountains, 1919 to 2006

Area change of glaciers in the Canadian Rocky Mountains, 1919 to 2006

C. Tennant1, B. Menounos1,2, R. Wheate1,2, and J. J. Clague3
1Geography Program, University of Northern British Columbia, Prince George, British Columbia, V2N 4Z9, Canada
2Natural Resources and Environmental Studies Institute, University of Northern British Columbia, Prince George, British Columbia, V2N 4Z9, Canada
3Department of Earth Sciences, Simon Fraser University, Burnaby, British Columbia, V5A 1S6, Canada

Abstract. Glaciers in the Canadian Rocky Mountains constitute an important freshwater resource. To enhance our understanding of the influence climate and local topography have on glacier area, large numbers of glaciers of different sizes and attributes need to be monitored over periods of many decades. We used Interprovincial Boundary Commission Survey (IBCS) maps of the Alberta–British Columbia (BC) border (1903–1924), BC Terrain Resource Information Management (TRIM) data (1982–1987), and Landsat Thematic Mapper (TM) and Enhanced Thematic Mapper (ETM+) imagery (2000–2002 and 2006) to document planimetric changes in glacier cover in the central and southern Canadian Rocky Mountains between 1919 and 2006. Over this period, glacier cover in the study area decreased by 590 ± 70 km2 (40 ± 5%), 17 of 523 glaciers disappeared and 124 glaciers fragmented into multiple ice masses. Glaciers smaller than 1.0 km2 experienced the greatest relative area loss (64 ± 8%), and relative area loss is more variable with small glaciers, suggesting that the local topographic setting controls the response of these glaciers to climate change. Small glaciers with low slopes, low mean/median elevations, south to west aspects, and high insolation experienced the largest reduction in area. Similar rates of area change characterize the periods 1919–1985 and 1985–2001; −6.3 ± 0.6 km2 yr−1 (−0.4 ± 0.1% yr−1) and −5.0 ± 0.5 km2 yr−1 (−0.5 ± 0.1% yr−1), respectively. The rate of area loss, however, increased over the period 2001–2006; −19.3 ± 2.4 km2 yr−1 (−2.0 ± 0.2% yr−1). Applying size class-specific scaling factors, we estimate a total reduction in glacier cover in the central and southern Canadian Rocky Mountains for the period 1919–2006 of 750 km2 (30%).
 
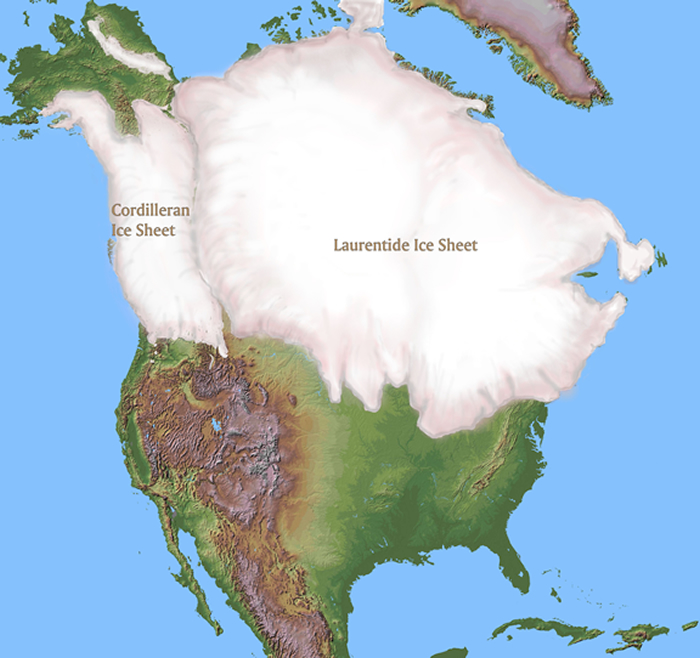
glacial_maximum_map2.jpg


Glacier have been melting for the past 14,000 years.
 
I stay away from these threads generally because I have no opinion about global warming but the Arctic ice caps are melting.

We have a company that makes the technology which satellites use to precisely measure the earth for all sorts of reasons, and they say there is zero doubt that the Arctic ice caps are getting smaller.

Interestingly, according to this firm, the Antarctic glaciers are not.
 
I wonder how much ice actually melts, and how much sublimates?
There's a difference y'know.

Good point. The ice in the continental glaciers, other than Antarctica, are melting. In Antarctica, surface loss is mostly sublimation. Most of the Antarctic loss is from glaciers pushing out into the sea, in the areas where the sea shelves have broken up. The glaciers there have not gotten smaller, as on the other continents, but have started moving toward the sea faster than in the little time we have observed that continent.
 
Don't take this wrong, but, so what? There was more glacial loss before 1900 than there has been after 1900...and by a lot. Myopic studies that don't look at historical trends are meaningless.
 
Don't take this wrong, but, so what? There was more glacial loss before 1900 than there has been after 1900...and by a lot. Myopic studies that don't look at historical trends are meaningless.

That is your claim. I note no confirming link to a scientific source.
 
Don't take this wrong, but, so what? There was more glacial loss before 1900 than there has been after 1900...and by a lot. Myopic studies that don't look at historical trends are meaningless.

That is your claim. I note no confirming link to a scientific source.

Is this another "Oh no! It's the Great Glacier Eating CO2 Spaghetti Monster, Charlie Brown!!" Thread?
 
I stay away from these threads generally because I have no opinion about global warming but the Arctic ice caps are melting.

We have a company that makes the technology which satellites use to precisely measure the earth for all sorts of reasons, and they say there is zero doubt that the Arctic ice caps are getting smaller.

Interestingly, according to this firm, the Antarctic glaciers are not.

Well, the antarctic glaciers don't visibly "shrink" as much under satellite observation, nor are they under as much visual satellite scrutiny. The mass of the Antarctic ice caps, however, is decreasing at an accelerating rate and a major contributor increasing sea-level rise.


"A Reconciled Estimate of Ice-Sheet Mass Balance" - http://xa.yimg.com/kq/groups/18383638/836588054/name/Science-2012-Shepherd-1183-9.pdf

- abstract
"We combined an ensemble of satellite altimetry, interferometry, and gravimetry data sets using
common geographical regions, time intervals, and models of surface mass balance and
glacial isostatic adjustment to estimate the mass balance of Earth​
[FONT=AdvTTdeec4450+20][FONT=AdvTTdeec4450+20]’
[/FONT]s polar ice sheets. We find that
there is good agreement between different satellite methods
[FONT=AdvTTdeec4450+20][FONT=AdvTTdeec4450+20]—[/FONT][/FONT]especially in Greenland and
West Antarctica
[FONT=AdvTTdeec4450+20][FONT=AdvTTdeec4450+20]—[/FONT][/FONT]and that combining satellite data sets leads to greater certainty. Between 1992
and 2011, the ice sheets of Greenland, East Antarctica, West Antarctica, and the Antarctic
Peninsula changed in mass by
[FONT=AdvTTdeec4450+20][FONT=AdvTTdeec4450+20]–[/FONT][/FONT]142 T 49, +14 T 43, [FONT=AdvTTdeec4450+20][FONT=AdvTTdeec4450+20]–[/FONT][/FONT]65 T 26, and [FONT=AdvTTdeec4450+20][FONT=AdvTTdeec4450+20]–[/FONT][/FONT]20 T 14 gigatonnes year[FONT=AdvTTdeec4450+22][FONT=AdvTTdeec4450+22]−[/FONT][/FONT]1,
respectively. Since 1992, the polar ice sheets have contributed, on average, 0.59
T 0.20 millimeter

year
[FONT=AdvTTdeec4450+22][FONT=AdvTTdeec4450+22]−[/FONT][/FONT]1 to the rate of global sea-level rise."
[/FONT]
 
I wonder how much ice actually melts, and how much sublimates?
There's a difference y'know.

Indeed most melting in Antarctic glaciers is occurring at their bases and in the underwater groundings where the glaciers run into the seas. The sublimation primarily effecting annual accumulations of new snow fall, the melting, removing ice glacier anchors and lubricating the surface contact, speeding their course to the oceans.

Here are some additional papers for those who are interested:

Antarctica

glacier ice in Beacon Valley, Antarctica

 
Don't take this wrong, but, so what? There was more glacial loss before 1900 than there has been after 1900...and by a lot. Myopic studies that don't look at historical trends are meaningless.

That is your claim. I note no confirming link to a scientific source.


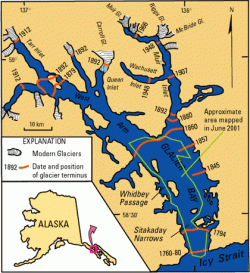
You mean you havn't seen this map?
 

Attachments

  • $glacierbaymap.gif
    $glacierbaymap.gif
    29.2 KB · Views: 55
Don't take this wrong, but, so what? There was more glacial loss before 1900 than there has been after 1900...and by a lot. Myopic studies that don't look at historical trends are meaningless.

That is your claim. I note no confirming link to a scientific source.


You mean you havn't seen this map?

That is one glacier. This is the state of most of the alpine glaciers, worldwide;

Then and Now Photographs Document Stunning Melting of Himalayan Glaciers : TreeHugger
 
Granny says, "Dat's right - if dis global warmin' keeps up, we all gonna melt...
:eek:
Canada could lose a fifth of its glaciers by 2100
Sun, Mar 10, 2013 - A fifth of Canada’s glaciers could be gone by the end of the century, a casualty of global warming that would drive a 3.5cm rise in sea levels, a study found on Thursday.
“Even if we only assume moderate global warming, it is still highly likely that the ice is going to melt at an alarming rate,” said lead author Jan Lenaerts, a meteorologist at Utrecht University in the Netherlands. And “the chances of it growing back are very slim,” he said. He said the process was both irreversible and self-reinforcing — because the snow and ice in the tundra and in the waters of northern Canada currently help reflect away some of the sun’s heat.

As they disappear, a larger portion of the suns rays will be absorbed by the water and land, which will cause temperatures to soar. If Canada’s glaciers shrink by 20 percent, as under this scenario, that would correspond to an average global temperature rise of 3°C. However, the temperature jump in the glacial regions of northern Canada would be far higher: 8°C, according to estimates by Lenaerts, who emphasized that this is not even a worst-case scenario.

The scientists urged policymakers to consider the prospect, saying that since 2000, the temperature in Canada’s Arctic Archipelago has risen by 1°C to 2°C, and the volume of ice has significantly diminished. Over the least 20 years, sea level has risen on average by more than 5.3cm. Most of that increase has been attributed to the thermal expansion of water, with just a fifth coming from the melting of the polar ice caps, according to an international study published in November last year in the US journal Science.

Canada could lose a fifth of its glaciers by 2100 - Taipei Times
 
Don't take this wrong, but, so what? There was more glacial loss before 1900 than there has been after 1900...and by a lot. Myopic studies that don't look at historical trends are meaningless.

That is your claim. I note no confirming link to a scientific source.

Actually....the study you posted also has more km^2/ year melting earlier
1919–1985 ; −6.3 ± 0.6 km2 yr−1
and 1985–2001 −5.0 ± 0.5 km2 yr−1
glacier ice melt down by 21 % while CO2 went up by ~ 8%

At the end of the 1919- 1985 period CO2 was at 344.88 ppm
And in 2001 CO2 was 371.49 ppm

So where is the correlation with CO2 ?

Don`t take it the wrong way.I`m an engineer and it is in our nature to crunch numbers.
We use numbers, not adjectives like "alarming", or "increased" and go by facts only, not by "the study suggests that" and "likely" or "is believed to be"
That`s the stuff that should be confined to political pollsters/spin doctors and has no business to rear it`s head in science

This is not a personal attack on you, you only quoted the "study" and did not make an explicit assertion that CO2 was responsible for melting more ice.
You zoomed in where the author of the study wanted you to zoom in and highlighted the assertions he made:
Applying size class-specific scaling factors, we estimate a total reduction in glacier cover in the central and southern Canadian Rocky Mountains for the period 1919–2006 of 750 km2 (30%).
While an engineer would notice that the "we estimate" was incorporating the higher melt rates when the CO2 was lower to "estimate" a melt increase up to 2006
That kind of "science", used in the study you quoted was called "Psychohistory" by Isaac Asimov.

Some individuals and groups, inspired by Asimov's psychohistory, seriously explore the possibility of a working psychohistory not unlike the one imagined by Asimov — a statistical study of history that could help in the formulation of some "theory of history" and perhaps become a tool of historical prediction
There is science and then there is science fiction. It`s important to understand the difference.
The key to successful neo-marxist social engineering and a IPCC UN soviet style central planning committee is a page taken right out of Asimov`s "Psychohistory":
that the population should remain in ignorance of the results of the application of psychohistorical analyses
Which is a fancy, but sadly true way to define the best method to get a"consensus"...especially so since books have been replaced with the new "social media"
 
Last edited:
Well now, I have only observed Canadian glaciers one time in my life, so have no personal data to base any opinion on, other than what scientists dealing with glacier in that area state. However, in my own backyard, I have seen substancial glacier melt in the North Cascades and on the Cascadian volcanic peaks. I have also seen the tree line in one area in the North Cascades where I hunt mineral move upward 500'. From 1973 to 2005.

Much of the John Day River is now to warm for trout after July, and smallmouth bass has become the primary gamefish downstream from the John Day Valley. The glacial terminus for the Nisqually Glacier has been steadily retreating. These are things that I have personally observed.
 
What happened before 1919? Global cooling? The industrial revolution was going full swing with coal, coal, coal fumes darkening the sky for the greater part of the 19th century but no warming.
 
What happened before 1919? Global cooling? The industrial revolution was going full swing with coal, coal, coal fumes darkening the sky for the greater part of the 19th century but no warming.

Atmospheric CO2 levels have gone up by about 40% in the last 150 years but over half of that increase has happened in the last 30 years. The increase in CO2 started slowly and built up gradually until around mid 20th Century when the increase began to accelerate sharply. The heat trapping effect of CO2 adds thermal energy to the system in a cumulative way like a snowball rolling downhill. We're at the point where the accumulated heat energy is starting to radically affect the Earth's climate systems.
 

Forum List

Back
Top