Old Rocks
Diamond Member
https://www.nsstc.uah.edu/climate/2017/october/tlt_update_bar_Oct2017.png
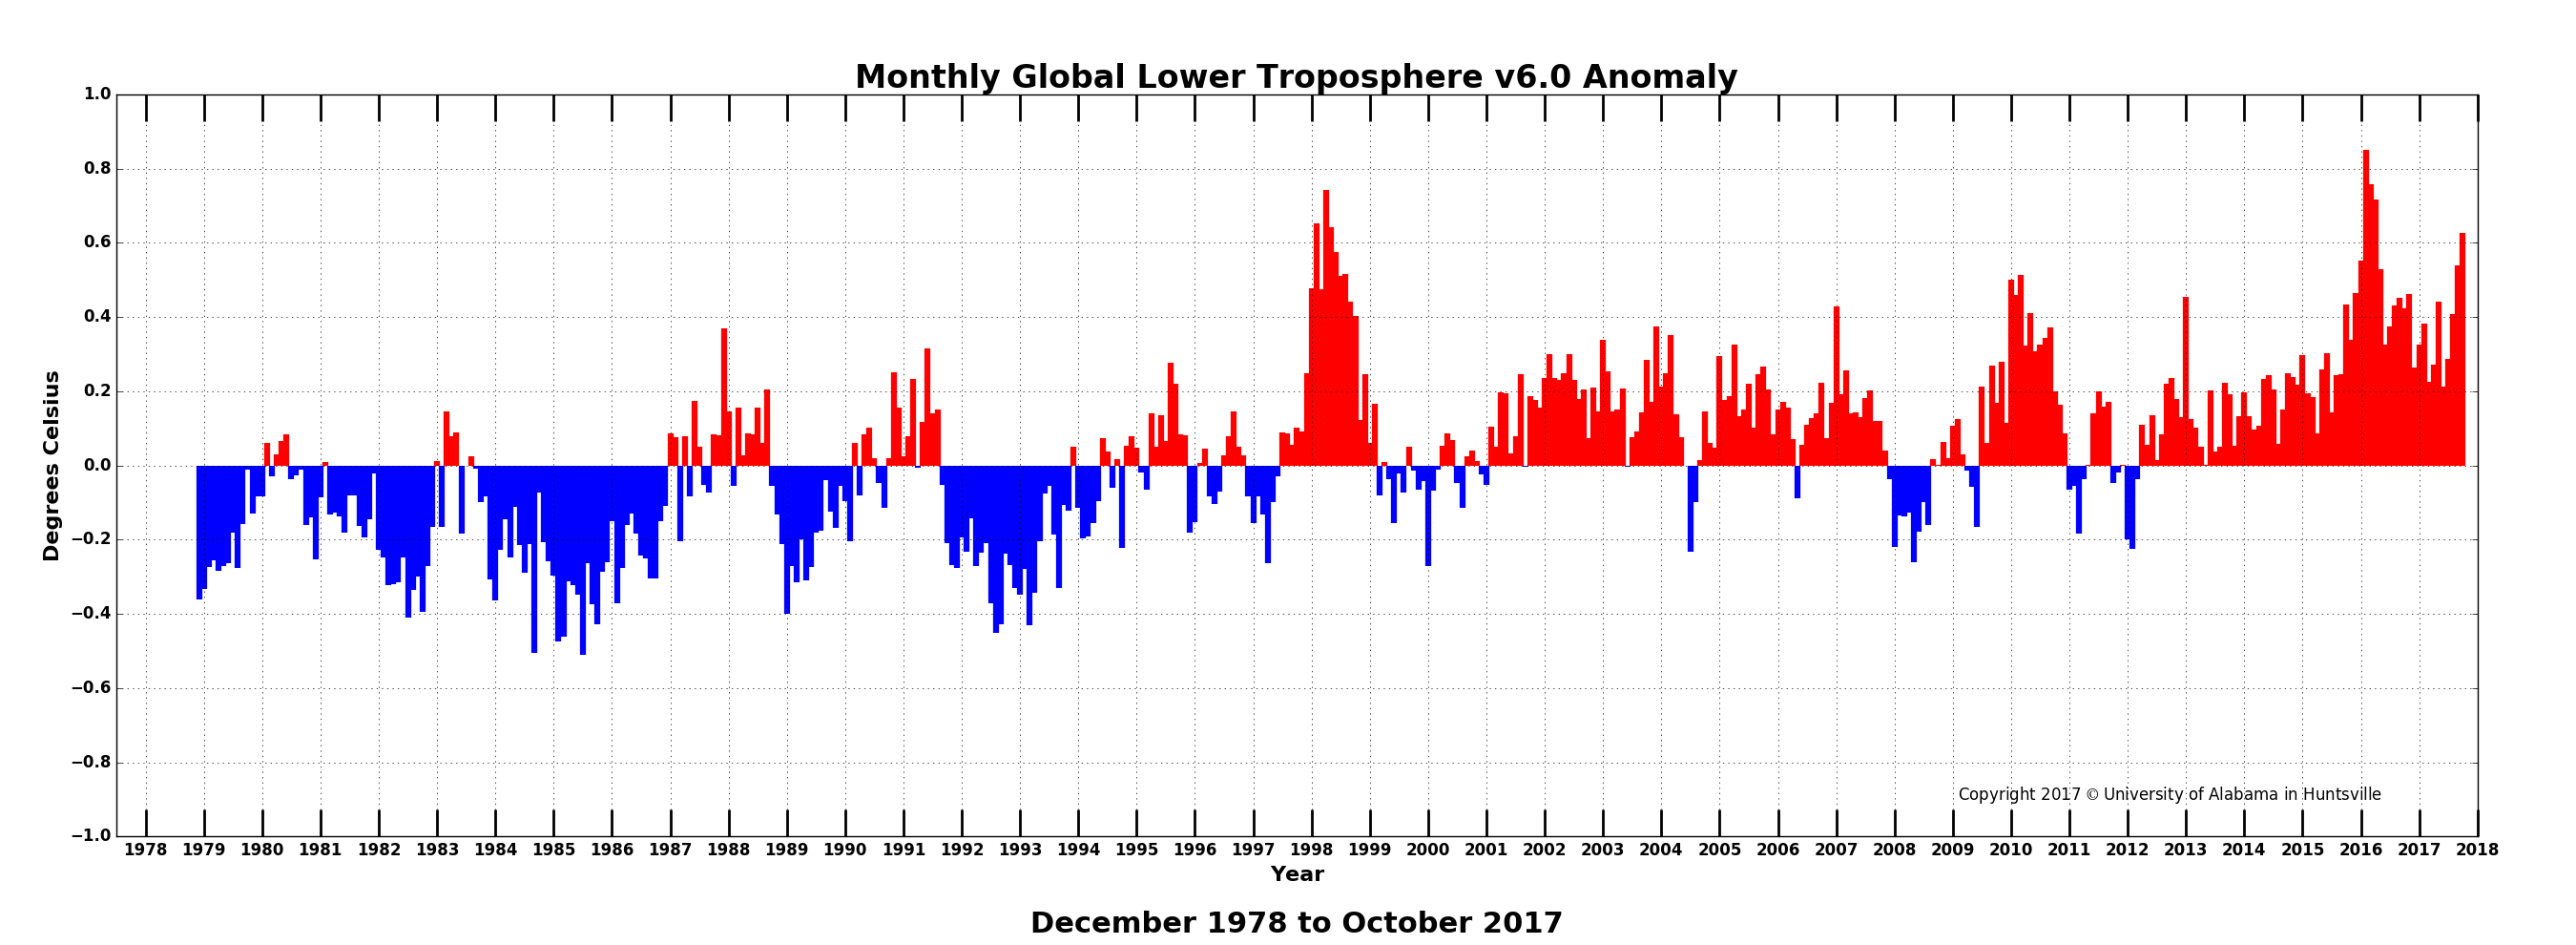
Now one has to be completely blind in order not to see that the slope of a line for the whole graph, or for the last 23 years.
Follow along with the video below to see how to install our site as a web app on your home screen.

Note: This feature currently requires accessing the site using the built-in Safari browser.
https://www.nsstc.uah.edu/climate/2017/october/tlt_update_bar_Oct2017.png
Now one has to be completely blind in order not to see that the slope of a line for the whole graph, or for the last 23 years.
Now Frankie boi, I just have to assume you are blind. LOL

Note where the readings are taken from? The "lower troposphere."......conveniently selected by the climate change industry. Its one of the main points in the research. But even forgetting that, a quick look at the graph above shows an average of about 0.3 degree's. Nobody cares........statistically insignificant. Climate activists present like its 30 degree's above normal. Lastly, it is established that computer modeling has no validity for predicting the future climate.......the NOAA itself said so back in the early 90's!!
Note where the readings are taken from? The "lower troposphere."......conveniently selected by the climate change industry. Its one of the main points in the research. But even forgetting that, a quick look at the graph above shows an average of about 0.3 degree's. Nobody cares........statistically insignificant. Climate activists present like its 30 degree's above normal. Lastly, it is established that computer modeling has no validity for predicting the future climate.......the NOAA itself said so back in the early 90's!!
Are thermometers even accurate to 0.3 degrees? I think the width of the line on the temperature chart is bigger than that.
 Looks impressive as hell if you are one of the stoopids of the world. All fakery if one pays attention..........