BLS Employment News Release: 119,000 fewer people working means lower unemployment?

hummm;


The labor force participation rate of the 55-years-and-older age group has increased from 32.4% in 2000 to 40.1% in 2010.
Source:

Bureau of Labor Statistics. (2011). Labor force statistics from the Current Population Survey. Retrieved February 22, 2011. Data available at
Databases, Tables & Calculators by Subject


According to a 2012 analysis of BLS statistics, "since December 2007, the employed population aged 55 and over has increased by about 3.9 million, or by nearly 15 percent....Much of the increase in the labor force participation and employment of older people in recent years is a result of the increase in the population aged 55 and over [from 69.6 million in December 2007 to 79.5 million in March 2012, an increase of more than 14 percent]. "Even if the labor force participation rate for this age group had remained at its December 2007 level (38.9 percent), the aged 55-plus labor force would have risen from 27.1 million to 30.9 million." (p. 4-5)
Source:

Rix, S. E. (2012). The employment situation, March 2012 AARP Public Policy Institute. Retrieved from http://www.aarp.org/content/dam/aar...nt-Situation-March-2012-AARP-ppi-econ-sec.pdf
 
Mort Zuckerman has a piece in the wsj for tomorrow. Pretty grim, this report was actually a lot worse than it looks, as he says, example- 15k manufacturing jobs took the axe, which figures since manuf. has been contracting ( under 50%) for 3 months. July was revised down by like 25K too.

The disappearing 368,000 from the roles were not retirees either, he checked the books, over 55 employment is up by 3.9 million, while total employment is down by 5 million.....

pretty harsh pickun's.
What a moronic way to "check" the number of retirees!!! Wouldn't over 55 employment be up due to working Boomers aging and entering the over 55 group. And how gullible do you have to be to not only swallow such a left-handed way of measuring retirees but also parrot it on a public forum as if it is gospel?

then rebut him, show us the sources/numbers that say that retirees are responsible for the lower labor force numbers.....


and I am STILL waiting for you to tell me how a retiree who leaves his job, has his job taken by someone who was unemployed, and not be accounted for in any of the numbers?
I have already shown YOU on other threads that studies have shown that 54% of Boomers are retired by age 65. People also retire at ages above 65 so that 54% of 300,000 new 65 year olds per month is a minimum number of retirees per month.

And why should I have to defend something YOU made up????
What I said was if a retiree's job is filled it is not a NEW job created, it is an OLD job filled by a new worker, so each month more jobs are filled than just the number of NEW jobs created.
Get it??????
 
hummm;


The labor force participation rate of the 55-years-and-older age group has increased from 32.4% in 2000 to 40.1% in 2010.
Source:

Bureau of Labor Statistics. (2011). Labor force statistics from the Current Population Survey. Retrieved February 22, 2011. Data available at
Databases, Tables & Calculators by Subject


According to a 2012 analysis of BLS statistics, "since December 2007, the employed population aged 55 and over has increased by about 3.9 million, or by nearly 15 percent....Much of the increase in the labor force participation and employment of older people in recent years is a result of the increase in the population aged 55 and over [from 69.6 million in December 2007 to 79.5 million in March 2012, an increase of more than 14 percent]. "Even if the labor force participation rate for this age group had remained at its December 2007 level (38.9 percent), the aged 55-plus labor force would have risen from 27.1 million to 30.9 million." (p. 4-5)
Source:

Rix, S. E. (2012). The employment situation, March 2012 AARP Public Policy Institute. Retrieved from http://www.aarp.org/content/dam/aar...nt-Situation-March-2012-AARP-ppi-econ-sec.pdf
Again that study has nothing to do with retirees, all it says is that the number of workers over 55 is increasing as the Boomers get older than 55. You still have about 6,000 Boomers retiring every day and will continue to do so for an additional 15 to 20 years no matter which Party is president.

How many people retire each day

10,000 baby boomers turn 65 years old everyday. About 60% of them are expected to retire - that is, about 6,000 per day.
 
What a moronic way to "check" the number of retirees!!! Wouldn't over 55 employment be up due to working Boomers aging and entering the over 55 group. And how gullible do you have to be to not only swallow such a left-handed way of measuring retirees but also parrot it on a public forum as if it is gospel?

then rebut him, show us the sources/numbers that say that retirees are responsible for the lower labor force numbers.....


and I am STILL waiting for you to tell me how a retiree who leaves his job, has his job taken by someone who was unemployed, and not be accounted for in any of the numbers?
I have already shown YOU on other threads that studies have shown that 54% of Boomers are retired by age 65. People also retire at ages above 65 so that 54% of 300,000 new 65 year olds per month is a minimum number of retirees per month.
And why should I have to defend something YOU made up????

what did I make up? :eusa_eh:

What I said was if a retiree's job is filled it is not a NEW job created, it is an OLD job filled by a new worker, so each month more jobs are filled than just the number of NEW jobs created.
Get it??????

so they are not counted in any of the data? they disappear from the unemployed ranks with no indicator, becasue they took a retirees job? that must be reflected somewhere, like lowering the number of unemployed....?

can I please see the links to that explanation and the numbers of those unemployed who have now become employed via a retiree position in the bls data?
 
hummm;


The labor force participation rate of the 55-years-and-older age group has increased from 32.4% in 2000 to 40.1% in 2010.
Source:

Bureau of Labor Statistics. (2011). Labor force statistics from the Current Population Survey. Retrieved February 22, 2011. Data available at
Databases, Tables & Calculators by Subject


According to a 2012 analysis of BLS statistics, "since December 2007, the employed population aged 55 and over has increased by about 3.9 million, or by nearly 15 percent....Much of the increase in the labor force participation and employment of older people in recent years is a result of the increase in the population aged 55 and over [from 69.6 million in December 2007 to 79.5 million in March 2012, an increase of more than 14 percent]. "Even if the labor force participation rate for this age group had remained at its December 2007 level (38.9 percent), the aged 55-plus labor force would have risen from 27.1 million to 30.9 million." (p. 4-5)
Source:

Rix, S. E. (2012). The employment situation, March 2012 AARP Public Policy Institute. Retrieved from http://www.aarp.org/content/dam/aar...nt-Situation-March-2012-AARP-ppi-econ-sec.pdf
Again that study has nothing to do with retirees, all it says is that the number of workers over 55 is increasing as the Boomers get older than 55. You still have about 6,000 Boomers retiring every day and will continue to do so for an additional 15 to 20 years no matter which Party is president.

How many people retire each day

10,000 baby boomers turn 65 years old everyday. About 60% of them are expected to retire - that is, about 6,000 per day.

Even if the labor force participation rate for this age group had remained at its December 2007 level (38.9 percent), the aged 55-plus labor force would have risen from 27.1 million to 30.9 million."
 
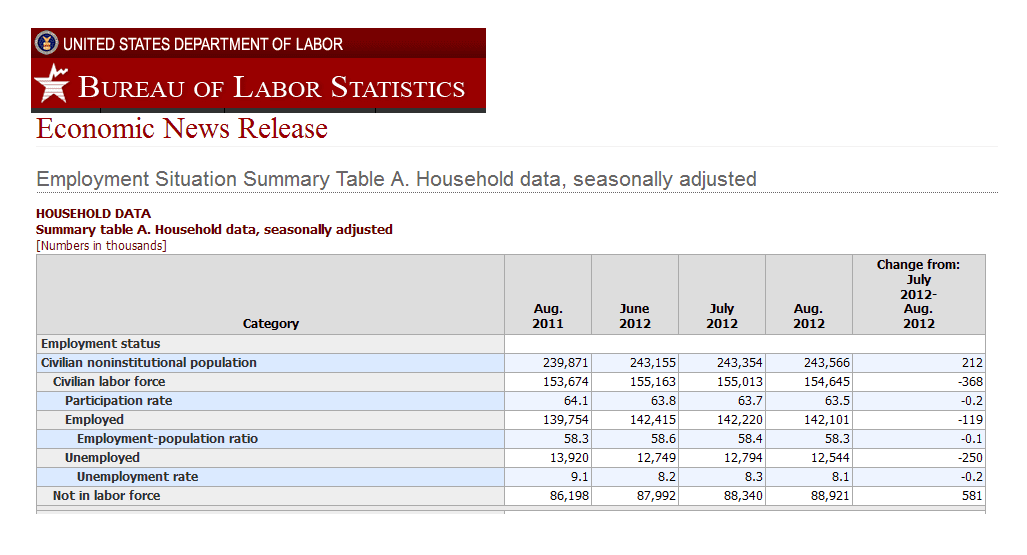
From the BLS website:
1208bls.png

Someone's shrinking the work force...
Yes ExPat, this is how America is run. Just like the Mafia. And the American people just lap it up!

The BLS isn't the only agency doing it. Just as a fish rots from the head down, I suspect all agencies cook their books.

We are in serious deep doo doo.
You understand this is not the conspiracy section, right?
You understand that Romney isn't gonna' fix this right? If he tries he'll just get "JFK'd".
 
hummm;


The labor force participation rate of the 55-years-and-older age group has increased from 32.4% in 2000 to 40.1% in 2010.
Source:

Bureau of Labor Statistics. (2011). Labor force statistics from the Current Population Survey. Retrieved February 22, 2011. Data available at
Databases, Tables & Calculators by Subject


According to a 2012 analysis of BLS statistics, "since December 2007, the employed population aged 55 and over has increased by about 3.9 million, or by nearly 15 percent....Much of the increase in the labor force participation and employment of older people in recent years is a result of the increase in the population aged 55 and over [from 69.6 million in December 2007 to 79.5 million in March 2012, an increase of more than 14 percent]. "Even if the labor force participation rate for this age group had remained at its December 2007 level (38.9 percent), the aged 55-plus labor force would have risen from 27.1 million to 30.9 million." (p. 4-5)
Source:

Rix, S. E. (2012). The employment situation, March 2012 AARP Public Policy Institute. Retrieved from http://www.aarp.org/content/dam/aar...nt-Situation-March-2012-AARP-ppi-econ-sec.pdf
Again that study has nothing to do with retirees, all it says is that the number of workers over 55 is increasing as the Boomers get older than 55. You still have about 6,000 Boomers retiring every day and will continue to do so for an additional 15 to 20 years no matter which Party is president.

How many people retire each day

10,000 baby boomers turn 65 years old everyday. About 60% of them are expected to retire - that is, about 6,000 per day.

Even if the labor force participation rate for this age group had remained at its December 2007 level (38.9 percent), the aged 55-plus labor force would have risen from 27.1 million to 30.9 million."
Retirement age is 65 so using data for 55 year olds to calculate the number of retirees is moronic at best and deliberately deceptive at worst, which is exactly why you are using it.

The LFP for 55-64 in 2010 was 64.9% and for those over 65 was 17.4% so obviously a significant number of workers retired once they passed 65 years old, but using your moronic 55+ numbers only 100,000 retired the last 4 years. :cuckoo:

Civilian labor force participation rates by age, sex, race, and ethnicity
 
Yes ExPat, this is how America is run. Just like the Mafia. And the American people just lap it up!

The BLS isn't the only agency doing it. Just as a fish rots from the head down, I suspect all agencies cook their books.

We are in serious deep doo doo.
You understand this is not the conspiracy section, right?
You understand that Romney isn't gonna' fix this right? If he tries he'll just get "JFK'd".

You understand this is not the Conspiracy Section, right, Loon?
 
Again that study has nothing to do with retirees, all it says is that the number of workers over 55 is increasing as the Boomers get older than 55. You still have about 6,000 Boomers retiring every day and will continue to do so for an additional 15 to 20 years no matter which Party is president.

How many people retire each day

10,000 baby boomers turn 65 years old everyday. About 60% of them are expected to retire - that is, about 6,000 per day.

Even if the labor force participation rate for this age group had remained at its December 2007 level (38.9 percent), the aged 55-plus labor force would have risen from 27.1 million to 30.9 million."
Retirement age is 65 so using data for 55 year olds to calculate the number of retirees is moronic at best and deliberately deceptive at worst, which is exactly why you are using it.

The LFP for 55-64 in 2010 was 64.9% and for those over 65 was 17.4% so obviously a significant number of workers retired once they passed 65 years old, but using your moronic 55+ numbers only 100,000 retired the last 4 years. :cuckoo:

Civilian labor force participation rates by age, sex, race, and ethnicity

hey idiot- I am not the one using that very same data to make the case that retirees as an excuse for the lower lpf am I? you are.

MORE people are STAYING in, in those cohorts than before, get it? they would BE in past years, those very same 'retirees'? thats the point......:lol:


so answer the question-

so they are not counted in any of the data? they disappear from the unemployed ranks with no indicator, becasue they took a retirees job? that must be reflected somewhere, like lowering the number of unemployed....?

can I please see the links to that explanation and the numbers of those unemployed who have now become employed via a retiree position in the bls data?
You are the one trying to claim that Boomers are not retiring in large numbers because a few are delaying retirement, which is moronic. Since there are larger numbers of Boomers reaching retirement age than past generations, you can have both larger numbers of them retiring as well as larger numbers of them delaying retirement. It is moronic to conclude that if more Boomers are delaying retirement than in the past generations then fewer Boomers must be retiring, which assumes that the Boomers exist in the same proportion as past generations which also contradicts why they are called Boomers in the first place. :cuckoo:

Admit it, you got suckered by a moronic statistic whose stupidity should have been obvious to you.
 
"I cannot undertake to lay my finger on that article of the Constitution which granted a right to Congress of expending, on objects of benevolence, the money of their constituents."
-- James Madison, the father of the U.S. Constitution
 
Retirement age is 65 so using data for 55 year olds to calculate the number of retirees is moronic at best and deliberately deceptive at worst, which is exactly why you are using it.

The LFP for 55-64 in 2010 was 64.9% and for those over 65 was 17.4% so obviously a significant number of workers retired once they passed 65 years old, but using your moronic 55+ numbers only 100,000 retired the last 4 years. :cuckoo:

Civilian labor force participation rates by age, sex, race, and ethnicity

hey idiot- I am not the one using that very same data to make the case that retirees as an excuse for the lower lpf am I? you are.

MORE people are STAYING in, in those cohorts than before, get it? they would BE in past years, those very same 'retirees'? thats the point......:lol:


so answer the question-

so they are not counted in any of the data? they disappear from the unemployed ranks with no indicator, becasue they took a retirees job? that must be reflected somewhere, like lowering the number of unemployed....?

can I please see the links to that explanation and the numbers of those unemployed who have now become employed via a retiree position in the bls data?
You are the one trying to claim that Boomers are not retiring in large numbers because a few are delaying retirement, which is moronic. Since there are larger numbers of Boomers reaching retirement age than past generations, you can have both larger numbers of them retiring as well as larger numbers of them delaying retirement. It is moronic to conclude that if more Boomers are delaying retirement than in the past generations then fewer Boomers must be retiring, which assumes that the Boomers exist in the same proportion as past generations which also contradicts why they are called Boomers in the first place. :cuckoo:

Admit it, you got suckered by a moronic statistic whose stupidity should have been obvious to you.

no, you're not getting away with that...nice try though.


I am saying you have not made case that they ARE, which you use as an excuse for the lpr dropping. you've never produced evidence to back up your claim , but I have produced sources, I gave you links that spoke to that 3.9 directly,from an aaarp study that found that people are deferring retirement and that the cohorts that in the past made up that range in the 55 and above, thats ABOVE segment, are now lower, they are scared and not leaving in the numbers they have in the past, you have yet to show anything refuting that AND validating your excuse for the lpr dropping due to retirees.


so answer this question 2nd request in this thread alone-

so they are not counted in any of the data? they disappear from the unemployed ranks with no indicator, becasue they took a retirees job? that must be reflected somewhere, like lowering the number of unemployed....?

can I please see the links to that explanation and the numbers of those unemployed who have now become employed via a retiree position in the bls data?
While it's hard to follow your broken english, the AARP study you cite says absolutely nothing about retirees, in fact there is not one mention of them in the entire study. So you are trying to take the participation rate of workers over 55 years old to draw conclusions about the number of retirees over 65 years old. :cuckoo:

I gave you BLS data that showed the LFP rate for 55-64 in 2010 was 64.9% and for those over 65 was 17.4%. Please explain how the LFP rate can drop over 70% as workers pass 65 years old if only 250,000 workers are retiring per year as you imply with your link.
 
Last edited:
August Unemployment Report Shows Continuing Stagnation
September 7, 2012 – The August unemployment report showed a labor market that has made virtually no progress all year, with the unemployment rate declining by 0.2 points to 8.1 percent as thousands of Americans gave up looking for work.
“The unemployment rate edged down in August to 8.1 percent. Since the beginning of this year, the rate has held in a narrow range of 8.1 to 8.3 percent. The number of unemployed persons, at 12.5 million, was little changed in August,” the Bureau of Labor Statistics (BLS) reported Friday. Despite a positive job creation number of 94,000 in August, major employment indicators remained basically unchanged. Unemployment rates for men, women, teens, whites, blacks, and Hispanics all “showed little or no change in August,” according to BLS. Likewise, the number of long-term unemployed – 27 weeks or longer – was “little changed” at 5 million.

Other key figures were significantly worse in August, lead by a drop in the labor force of 368,000 people. More pointedly, the number of Americans BLS reported as being ‘not in the labor force’ grew by 581,000 as people either took retirement or gave up looking for work all together. The number of those working part-time for economic reasons also showed little change, providing further evidence of a labor market plagued by a stubborn stagnation. “The number of persons employed part time for economic reasons (sometimes referred to as involuntary part-time workers) was little changed at 8.0 million in August. These individuals were working part time because their hours had been cut back or because they were unable to find a full-time job,” BLS reported.

Further underscoring the fact that the labor market has stagnated is the report that the numbers of those marginally attached to the labor force – unemployed, not looking for work, but still wanting a job – stayed unchanged from one year ago. “In August, 2.6 million persons were marginally attached to the labor force, essentially unchanged from a year earlier.” This number is particularly significant because it captures a segment of people who could and would work, were jobs available for them – as opposed to those who retire early, join the military, or leave the labor force for other reasons.

Source
Gee, the best August since 2006 is bad news to CON$. No surprise there!

August 2003: – 45,000
August 2004: +122,000
August 2005: +193,000
August 2006: +183,000
August 2007: – 18,000
August 2008: – 274,000
August 2009: – 231,000
August 2010: – 51,000 (worsened by Census layoffs)
August 2011: + 85,000
August 2012: + 96,000
43 straight months of unemployment 8% or higher
Are you better off? Just 96,000 jobs added in August as 368,000 people LEAVE the workforce in bleak employment report dealing blow to Obama re-election hopes

Read more: Obama's DNC 2012 speech: Bleak unemployment numbers morning after Obama tells DNC 'our problems can be solved' | Mail Online
 
You are the one trying to claim that Boomers are not retiring in large numbers because a few are delaying retirement, which is moronic. Since there are larger numbers of Boomers reaching retirement age than past generations, you can have both larger numbers of them retiring as well as larger numbers of them delaying retirement. It is moronic to conclude that if more Boomers are delaying retirement than in the past generations then fewer Boomers must be retiring, which assumes that the Boomers exist in the same proportion as past generations which also contradicts why they are called Boomers in the first place. :cuckoo:

Admit it, you got suckered by a moronic statistic whose stupidity should have been obvious to you.

no, you're not getting away with that...nice try though.


I am saying you have not made case that they ARE, which you use as an excuse for the lpr dropping. you've never produced evidence to back up your claim , but I have produced sources, I gave you links that spoke to that 3.9 directly,from an aaarp study that found that people are deferring retirement and that the cohorts that in the past made up that range in the 55 and above, thats ABOVE segment, are now lower, they are scared and not leaving in the numbers they have in the past, you have yet to show anything refuting that AND validating your excuse for the lpr dropping due to retirees.


so answer this question 2nd request in this thread alone-

so they are not counted in any of the data? they disappear from the unemployed ranks with no indicator, becasue they took a retirees job? that must be reflected somewhere, like lowering the number of unemployed....?

can I please see the links to that explanation and the numbers of those unemployed who have now become employed via a retiree position in the bls data?
While it's hard to follow your broken english, the AARP study you cite says absolutely nothing about retirees, in fact there is not one mention of them in the entire study. So you are trying to take the participation rate of workers over 55 years old to draw conclusions about the number of retirees over 65 years old. :cuckoo:

I gave you BLS data that showed the LFP rate for 55-64 in 2010 was 64.9% and for those over 65 was 17.4%. Please explain how the LFP rate can drop over 70% as workers pass 65 years old if only 250,000 workers are retiring per year as you imply with your link.

so the lpr drop you keep claiming (but cannot prove) is from only retirees above 65?


and, answer this question 3rd request in this thread alone-

so they are not counted in any of the data? they disappear from the unemployed ranks with no indicator, becasue they took a retirees job? that must be reflected somewhere, like lowering the number of unemployed....?

can I please see the links to that explanation and the numbers of those unemployed who have now become employed via a retiree position in the bls data
 
All those new 4 yr olds and under cannot work yet.

But since about 50% of them are born to unwed mothers you can count of social program costs going up.
 
Last edited:
no, you're not getting away with that...nice try though.


I am saying you have not made case that they ARE, which you use as an excuse for the lpr dropping. you've never produced evidence to back up your claim , but I have produced sources, I gave you links that spoke to that 3.9 directly,from an aaarp study that found that people are deferring retirement and that the cohorts that in the past made up that range in the 55 and above, thats ABOVE segment, are now lower, they are scared and not leaving in the numbers they have in the past, you have yet to show anything refuting that AND validating your excuse for the lpr dropping due to retirees.


so answer this question 2nd request in this thread alone-

so they are not counted in any of the data? they disappear from the unemployed ranks with no indicator, becasue they took a retirees job? that must be reflected somewhere, like lowering the number of unemployed....?

can I please see the links to that explanation and the numbers of those unemployed who have now become employed via a retiree position in the bls data?
While it's hard to follow your broken english, the AARP study you cite says absolutely nothing about retirees, in fact there is not one mention of them in the entire study. So you are trying to take the participation rate of workers over 55 years old to draw conclusions about the number of retirees over 65 years old. :cuckoo:

I gave you BLS data that showed the LFP rate for 55-64 in 2010 was 64.9% and for those over 65 was 17.4%. Please explain how the LFP rate can drop over 70% as workers pass 65 years old if only 250,000 workers are retiring per year as you imply with your link.

so the lpr drop you keep claiming (but cannot prove) is from only retirees above 65?


and, answer this question 3rd request in this thread alone-

so they are not counted in any of the data? they disappear from the unemployed ranks with no indicator, becasue they took a retirees job? that must be reflected somewhere, like lowering the number of unemployed....?

can I please see the links to that explanation and the numbers of those unemployed who have now become employed via a retiree position in the bls data
Again you create a Straw Man to argue against. I never said retirees were the ONLY reason for the drop in the LFP rate, I said they make up a significant portion of those who leave the workforce, as you well know. You also have family members leaving the workforce to take care of children, elderly, sick or disabled family members. You also have workers going back to school. You also have the aging workforce becoming disabled. But the largest number of workers leaving the workforce are the Boomers retiring.


Prove it , show me the numbers for the "significant numbers" you claim.

Disabled, why yes of course, all of a sudden, in the last 3 years jobs have become hugely more injurious to workers:lol:

and, answer this question 4th request in this thread alone-

so they are not counted in any of the data? they disappear from the unemployed ranks with no indicator, becasue they took a retirees job? that must be reflected somewhere, like lowering the number of unemployed....?
 
...look at totals:
Employment change since ’08 election: down 1,740,000

Population change since ’08 election: up 8,281,000

If presidential elections affect jobs, then the '08 choice hurt over ten million people.
Question for the group: does everyone here understand what these numbers mean?
Yeah, they mean you have to go back and add the numbers while the Bush policies were in effect, before Obama was even sworn in...
...yeah we have alot of 4 yr olds out there.
What's good is we're clear that there's no understanding on what the numbers mean. Let's review; we were looking at ed's post:
...
August 2003: – 45,000
August 2004: +122,000
August 2005: +193,000
August 2006: +183,000
August 2007: – 18,000
August 2008: – 274,000
August 2009: – 231,000
August 2010: – 51,000 (worsened by Census layoffs)
August 2011: + 85,000
August 2012: + 96,000
--and how that's why Ed believes electing Obama was good for jobs. Let's focus together and see where this goes:
1. Presidents don't make jobs, private employers do.

2. Election choices can make it easier or harder for private job creation, and we gage the impact of our '08 choice by looking at how jobs changed since then.​
Our choices have consequences. Since we made our choice in '08 employment's dropped by 1,740,000 even while the US population grew by 8,281,000. We need to agree that this is not what we had in mind back in '08.
 
so the lpr drop you keep claiming (but cannot prove) is from only retirees above 65?


and, answer this question 3rd request in this thread alone-

so they are not counted in any of the data? they disappear from the unemployed ranks with no indicator, becasue they took a retirees job? that must be reflected somewhere, like lowering the number of unemployed....?

can I please see the links to that explanation and the numbers of those unemployed who have now become employed via a retiree position in the bls data
Again you create a Straw Man to argue against. I never said retirees were the ONLY reason for the drop in the LFP rate, I said they make up a significant portion of those who leave the workforce, as you well know. You also have family members leaving the workforce to take care of children, elderly, sick or disabled family members. You also have workers going back to school. You also have the aging workforce becoming disabled. But the largest number of workers leaving the workforce are the Boomers retiring.


Prove it , show me the numbers for the "significant numbers" you claim.

Disabled, why yes of course, all of a sudden, in the last 3 years jobs have become hugely more injurious to workers:lol:

and, answer this question 4th request in this thread alone-

so they are not counted in any of the data? they disappear from the unemployed ranks with no indicator, becasue they took a retirees job? that must be reflected somewhere, like lowering the number of unemployed....?
Again you play dumb in order to create your Straw Man. It is not the jobs that change but the AGING workforce that becomes more vulnerable to breakdown as they age. Seriously, how stupid do you have to pretend to be to pretend that old age does not slowly cause the physical body to break down over time.

Regarding the Right-wing nut Zuckerman's phony numbers, you can calculate the number of new retirees and disabled from Dec 2007 to Aug 2012 by plugging those numbers into the below link. Now remember using his method of calculating the over 55 workforce population to determine the number of retirees there can only be less than 1 million retirees and disabled over this period.
In 2007 there were 31.5 million retired and 7.1 million disabled.
In 2012 there were 36.4 million retired and 8.8 million disabled.
That's 5.6 million leaving the workforce, considerably more than the Zuckerman/AARP method of calculation that you use.

Number of Social Security recipients by type of beneficiary
 

Forum List

Back
Top