Arctic Sea Ice Continues Expansion

Once again, avoiding an answer. Braindead troll, incapable of research.

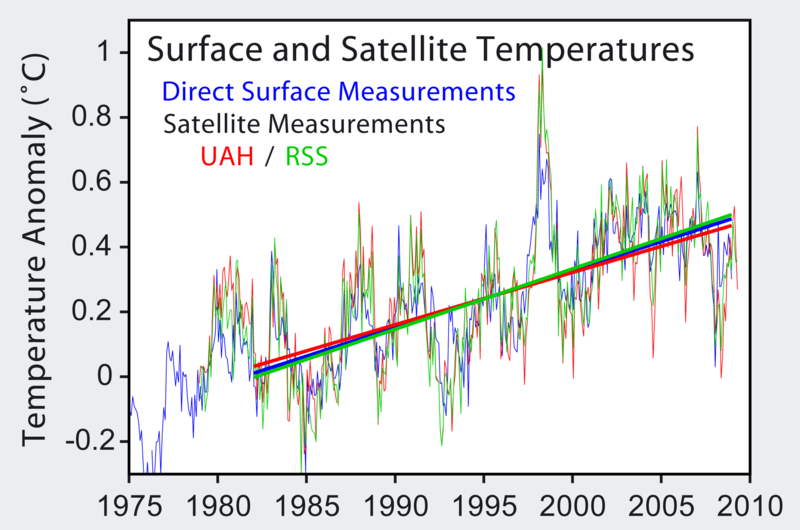
And it is the satellites and isolated villages that are recording the temperatures there, not Mann or Jones.


Another problem for the land based stations. Of the stations submitting data, only 40% were used and they were the ones with incomplete data sets.

The soup just keeps getting thicker. According to the Russians, all of the data stations not used show no warming and yet the maps provided on this board consistantly show a bunch of red dots over Russia. Are the red dots cherries for the picking?

This is an excellent method to remove heat islands from Russia.

Of course, since the data from East Anglia was destroyed, there is no way to examine it.

Convenient for those who like their tracks, and backsides, covered.

Climate Change Fraud - Russians accuse Hadley Centre of falsifying Russian temperatures
 
It became apparrent to me that using 1998 as a starting point to measure cooling was a gimme. It's very similar to using 1880 as a starting point to measure warming.

Your clinging devotion to land stations is touching. There are more problems than one can list with these, but here is some referance material.

“The hardest part is trying to influence the nature of the measurements obtained…” « Watts Up With That?

GISS “raw” station data – before and after « Watts Up With That?

Global Warming Science and Public Policy - Temperature Change and CO2 Change - A Scientific Briefing

Data @ NASA GISS: GISS Surface Temperature Analysis: Station Data
I pulled this quote from your first link:

"He actually says, in the second paragraph, “The hardest part is trying to influence the nature of the measurements obtained, so that the key information can be obtained.”

To me this sounds like spin for “The hardest part is making the numbers show what I want them to”. Let’s see how long it takes for that sentence in the NASA GISS website to get changed."

Because your source is toooooooo ignorant of what the satellites pick up, he spins it as spin and not his ignorance.

For example, when satellites try to read the lower Troposphere, interference from the colder Stratosphere is also picked up and must be filtered out so the key Troposphere information can be obtained. Another influence in the nature of the measurements by satellites is Diurnal Drift, which must adjusted for to get accurate and therefore useful data.

And your totally discredited Monckton link used the cooked Christy and Spencer Troposphere chart where they were caught using the wrong sign to correct for Diurnal Satellite Drift. The inaccuracy of that chart has been pointed out to you for years on this board and the AOL boards, yet you still use it thinking you might yet deceive me. :cuckoo:

Insanity is doing the same thing over and over again and expecting different results.
- Albert Einstein


Please provide the link as it applies to the examples that you cite.

Looks like the mods are trying to pull a fast one. I posted links already and they "magically" disappeared without comment.

Here is a chart of the Troposphere temps from RSS and UAH along with the surface temps and as anyone can see all 3 show warming. The Troposphere UAH chart used by the completely discredited Lord Monckton is from data that was shown to use the opposite sign to calculate Diurnal Satellite Drift and the slope is in the opposite direction.
800px-Satellite_Temperatures.png


And here is the link to a paper co-authored by John Christy where he admits that when his errors are corrected, there is no discrepency between Troposphere temps and surface temps:

http://www.climatescience.gov/Library/sap/sap1-1/finalreport/sap1-1-final-execsum.pdf

Previously reported discrepancies between the amount of warming
near the surface and higher in the atmosphere have been used to
challenge the reliability of climate models and the reality of humaninduced
global warming.
Specifically, surface data showed substantial
global-average warming, while early versions of satellite and radiosonde
data showed little or no warming above the surface. This significant
discrepancy no longer exists because errors in the satellite and
radiosonde data have been identified and corrected.
New data sets
have also been developed that do not show such discrepancies.

Is this from the same group of buffons, who had their temperature sensors next to artifical heat sources....LOL
Another dufuss who knows nothing about anomalies and less about satellites. :cuckoo:
 
Interesting. Russia is now one of the primary producers of fossil fuels. And we see researchers like Semiletov suddenly working for the University of Alaska, rather than the Russian government. And the news that the real scientists are generating in Siberia speaks of increasing emissions of CH4 from the yedoma.

There is a real fast positive feedback cycle working in the Arctic now. And you dolts are yapping about stolen e-mails. Your grandchildren, those that survive, will piss on your graves.

My grandchildren will find yours and piss on it. how's that, osama?
 
I don't think there is any doubt that arctic sea ice is growing quite fast this year.

You will also notice that the same sources which confirm this, also confirm that arctic ice is thinning as a general trend, that glaciers are in full retreat, and that ocean ph is changing rapidly.

Rather than just cherrypick one figure here and one chart there, it is important to look at the bigger trend HONESTLY.
 
Ice still expanding.

Libs still in denial.

No, you have completely and utterly misunderstood the science. In fact, would it be fair to say you have not actually look at the science in any detail?

Yes, ice is expanding this year.

Yes, the trend for arctic ice is dramatically thinning, decade after decade.

Decade after decade? Thank you fir the complete history lesson Uncle Fester. :lol:

How many ice ages were there again? 4? 5?

What came between the ice ages? Would that be periods of warming where the ice melted and the glaciers retreated?

Meanwhile we've got icebergs floating around Australia for the last 10+years. But ZOMG, we're melting...
 

Forum List

Back
Top