Arctic sea ice BACK to Normal!

I know that only 6% of scientists are Republicans.

Every time I read one of your posts I wonder what % of Democrats are rude, inconsiderate ignoramuses with no concept of rational thought or courteous discourse.

Just the fact you list "liberal logic" and then write some zany nonsense only a fool would believe proves you are both a dumbass and a tard. Too stupid to even know it's YOU who's rude.


Do you deny that Liberals today assert that the price of gas is beyond the control or influence of any human being and also assert that the climate is a system that is both understood and can me controlled by Man?

No, you fucking idiot. The climate can be made worse by man. Look at that rotten cesspool you live in. Would it be there without you making it? But it can't be "controlled", only "influenced".

The price of gas is controlled by the "world market". If we could control it, when why don't we? After all, gas is our number one export. We have so much gas, it's our number one export. Did you even know that?

How can you argue a point, when you start off with delusions, made up bullshit and a lack of understanding ANYTHING? Explain that!
 
This is a good recovery of sea ice extant this year. Unfortunately, it is only single year ice. This extent of the ice melt this summer will determine if we have actually seen any recovery of ice. But even this little is a good thing.

We will see what the melt is this summer, and what the clathrates do off the East Siberian Artic Shelf. We need a low melt, and a much lower outgassing than last year. We get a high melt, and an increase in that outgassing, then this winters freeze simply was an anolomy from a double La Nina.

We're still waiting for:

1. A repeatable lab experiment that show how a .01% change in atmospheric composition by adding a homeopathic amount of CO2 does ANY of the things you suggest, and

2. A coherent explanation as to how CO2 is both decreasing in the "warming" oceans in a "Feedback Loop" and increasing in the oceans turning them "Acidic" because the two concepts are mutually exclusive.
 
That is wonderful that Artic Ice is "normal". With all do respect: from a layperson's point of view, I find this information a bit...questionable. But, I am glad to hear it's "NORMAL" somewere. It has been 75 to 80 degrees and bone dry in the midwest for months. This IS the very definition of "Global Warming". Color me a tad sceptical.

The present large, as compared to the last few years, freezeup is there. But it is only single year ice, and it will have to survive the summer, and add a couple more years of like temperatures before the Arctic Sea Ice Pack is anything like normal.

What the fuck is "Normal"?

We live on a planet spinning in space and our main sources of heat is a pile of plasma, how do you define "Normal" so tightly under those conditions?
 
Hmmmmm...

Shouldn't there already be a post with the link to the research of Svante Arrhenius in this thread?

Oh Hell!

The Carbon Dioxide Greenhouse Effect

In 1896 Svante Arrhenius calculated the effect of a doubling atmospheric carbon dioxide to be an increase in surface temperatures of 5-6 degrees Celsius.

You are obviously mistaken. When confronted by a departure of reality from model, we know that we are to ignore reality and stick with the models.

Don't you know anything about science?

Yes, in 1896, Arrhenius made that prediciton with the understanding of the science of that time. Now we have increased the CO2 in the atmosphere by 40% and the average temperature by 0.7 C.

We have also put a lot of aerosols into the atmosphere, which helps cool things a bit. And the modern estimate for the doubling of CO2 is more like 3 C. Which you would have known had you read the whole article. But that is written by real scientists and they don't work for large energy corps that do not want to be held accountable for what their activities are causing.

Interestingly, while the temps have not gone up as fast as the models predicted, the affect have been far greater than anyone's models for this temperature increase. From the melting of glaciers, continental ice caps, and Arctic sea ice, all have exceeded even the alarmists predictions.


I know, I know...

All of the iced is melting and the sea level rate of rise has increased from 2mm/year to 3mm/year.

The problem with this is that the previous rate of 2 mm/year wasn't happening. The shorelines are all exactly where they were and the ocean levels that you say have risen dramatically as measured by satellites are actually further away from land marks like the boat houses of Herculaneum where hundreds perished 2000 years ago.

Both their refuge and their skeletons are buried under the ash, but are still well away from the shore line.
 
That is wonderful that Artic Ice is "normal". With all do respect: from a layperson's point of view, I find this information a bit...questionable. But, I am glad to hear it's "NORMAL" somewere. It has been 75 to 80 degrees and bone dry in the midwest for months. This IS the very definition of "Global Warming". Color me a tad sceptical.

The present large, as compared to the last few years, freezeup is there. But it is only single year ice, and it will have to survive the summer, and add a couple more years of like temperatures before the Arctic Sea Ice Pack is anything like normal.


But all of the most recent years show recovery, not just this year. Since 2006-7, all of the Ice extent measures are up and all have been in the range of standard deviation.

The trouble with facts, that is, facts before Dr. Hansen replaces them with more preferred facts, is that they are so factual.
 
Just the fact you list "liberal logic" and then write some zany nonsense only a fool would believe proves you are both a dumbass and a tard. Too stupid to even know it's YOU who's rude.


Do you deny that Liberals today assert that the price of gas is beyond the control or influence of any human being and also assert that the climate is a system that is both understood and can me controlled by Man?

No, you fucking idiot. The climate can be made worse by man. Look at that rotten cesspool you live in. Would it be there without you making it? But it can't be "controlled", only "influenced".

The price of gas is controlled by the "world market". If we could control it, when why don't we? After all, gas is our number one export. We have so much gas, it's our number one export. Did you even know that?

How can you argue a point, when you start off with delusions, made up bullshit and a lack of understanding ANYTHING? Explain that!



Seem to have touched a nerve.

I was only quoting the Liberals in our political system who say that we can control the climate and have no influence whatsoever on the price of Gas.

Let's see... Which Liberal was it who said that... Oh, i know! It was the Big 0, your Messiah.

I would have thought you'd have recognized the words of the man who is making the sea level drop.

What a guy!
 
That is wonderful that Artic Ice is "normal". With all do respect: from a layperson's point of view, I find this information a bit...questionable. But, I am glad to hear it's "NORMAL" somewere. It has been 75 to 80 degrees and bone dry in the midwest for months. This IS the very definition of "Global Warming". Color me a tad sceptical.

The present large, as compared to the last few years, freezeup is there. But it is only single year ice, and it will have to survive the summer, and add a couple more years of like temperatures before the Arctic Sea Ice Pack is anything like normal.


But all of the most recent years show recovery, not just this year. Since 2006-7, all of the Ice extent measures are up and all have been in the range of standard deviation.

The trouble with facts, that is, facts before Dr. Hansen replaces them with more preferred facts, is that they are so factual.


Really, Code, do you expect to tell a lie like that and get away with it?

http://arctic.atmos.uiuc.edu/cryosphere/IMAGES/seaice.area.arctic.png

One can easily see from the graph that the last five years have all been low. Low on bottom, low on top.

1979, high point over 15 million square miles, since 2005, max extent has been under 14 million every year.

1979, low point over 5 million square miles, 2007, and 2011 under 3 million square miles. All years since 2007 have been under 3.5 million square miles.

We are at about this years high point and still under 14 million square miles.
 
The present large, as compared to the last few years, freezeup is there. But it is only single year ice, and it will have to survive the summer, and add a couple more years of like temperatures before the Arctic Sea Ice Pack is anything like normal.

But all of the most recent years show recovery, not just this year. Since 2006-7, all of the Ice extent measures are up and all have been in the range of standard deviation.

The trouble with facts, that is, facts before Dr. Hansen replaces them with more preferred facts, is that they are so factual.


Really, Code, do you expect to tell a lie like that and get away with it?

http://arctic.atmos.uiuc.edu/cryosphere/IMAGES/seaice.area.arctic.png

One can easily see from the graph that the last five years have all been low. Low on bottom, low on top.

1979, high point over 15 million square miles, since 2005, max extent has been under 14 million every year.

1979, low point over 5 million square miles, 2007, and 2011 under 3 million square miles. All years since 2007 have been under 3.5 million square miles.

We are at about this years high point and still under 14 million square miles.

And?

What's the point of that graph?
 
The present large, as compared to the last few years, freezeup is there. But it is only single year ice, and it will have to survive the summer, and add a couple more years of like temperatures before the Arctic Sea Ice Pack is anything like normal.


But all of the most recent years show recovery, not just this year. Since 2006-7, all of the Ice extent measures are up and all have been in the range of standard deviation.

The trouble with facts, that is, facts before Dr. Hansen replaces them with more preferred facts, is that they are so factual.


Really, Code, do you expect to tell a lie like that and get away with it?

http://arctic.atmos.uiuc.edu/cryosphere/IMAGES/seaice.area.arctic.png

One can easily see from the graph that the last five years have all been low. Low on bottom, low on top.

1979, high point over 15 million square miles, since 2005, max extent has been under 14 million every year.

1979, low point over 5 million square miles, 2007, and 2011 under 3 million square miles. All years since 2007 have been under 3.5 million square miles.

We are at about this years high point and still under 14 million square miles.

So what happened to your "Wider and wider swings" Theory? Where are they in the chart?
 
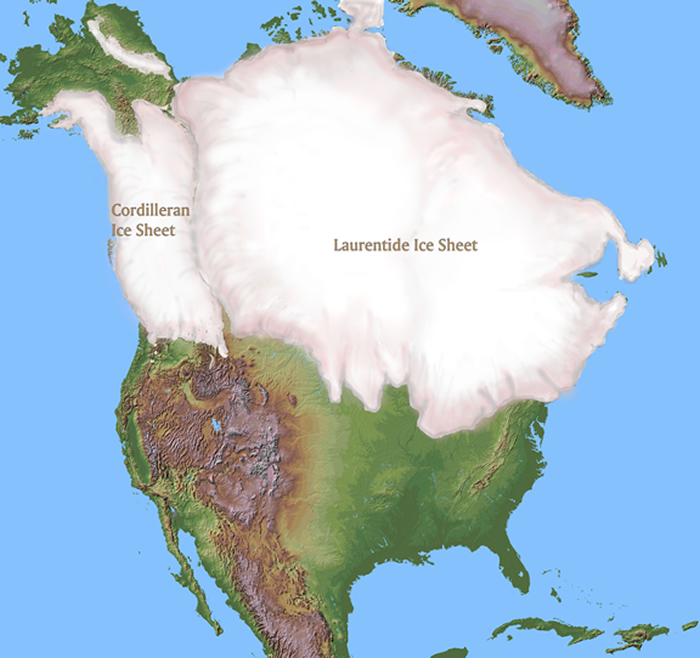
Has anyone truly established what normal is for Arctic ice? Man's history is rather short.
 
Has anyone truly established what normal is for Arctic ice? Man's history is rather short.

glacial_maximum_map2.jpg
 
But all of the most recent years show recovery, not just this year. Since 2006-7, all of the Ice extent measures are up and all have been in the range of standard deviation.

The trouble with facts, that is, facts before Dr. Hansen replaces them with more preferred facts, is that they are so factual.


Really, Code, do you expect to tell a lie like that and get away with it?

http://arctic.atmos.uiuc.edu/cryosphere/IMAGES/seaice.area.arctic.png

One can easily see from the graph that the last five years have all been low. Low on bottom, low on top.

1979, high point over 15 million square miles, since 2005, max extent has been under 14 million every year.

1979, low point over 5 million square miles, 2007, and 2011 under 3 million square miles. All years since 2007 have been under 3.5 million square miles.

We are at about this years high point and still under 14 million square miles.

And?

What's the point of that graph?

Since you had to ask, you wouldn't be capable of understanding the answer.
 
The point of the graph seems to be that the Northern Hemisphere Sea Ice has been relatively stable since 1979.
 
Really, Code, do you expect to tell a lie like that and get away with it?

http://arctic.atmos.uiuc.edu/cryosphere/IMAGES/seaice.area.arctic.png

One can easily see from the graph that the last five years have all been low. Low on bottom, low on top.

1979, high point over 15 million square miles, since 2005, max extent has been under 14 million every year.

1979, low point over 5 million square miles, 2007, and 2011 under 3 million square miles. All years since 2007 have been under 3.5 million square miles.

We are at about this years high point and still under 14 million square miles.

And?

What's the point of that graph?

Since you had to ask, you wouldn't be capable of understanding the answer.

Let me guess, prior to the invention of the internal combustion engine, there was never any variation in the graph, right?

Also, where's that one repeatable experiment that shows us how a .01% change in atmospheric composition by adding a wisp of CO2 causes "Global Warming"

You're such a fucking lying scumbag --and an idiot to boot and you insult me?

LOL
 
The present large, as compared to the last few years, freezeup is there. But it is only single year ice, and it will have to survive the summer, and add a couple more years of like temperatures before the Arctic Sea Ice Pack is anything like normal.


But all of the most recent years show recovery, not just this year. Since 2006-7, all of the Ice extent measures are up and all have been in the range of standard deviation.

The trouble with facts, that is, facts before Dr. Hansen replaces them with more preferred facts, is that they are so factual.


Really, Code, do you expect to tell a lie like that and get away with it?

http://arctic.atmos.uiuc.edu/cryosphere/IMAGES/seaice.area.arctic.png

One can easily see from the graph that the last five years have all been low. Low on bottom, low on top.

1979, high point over 15 million square miles, since 2005, max extent has been under 14 million every year.

1979, low point over 5 million square miles, 2007, and 2011 under 3 million square miles. All years since 2007 have been under 3.5 million square miles.

We are at about this years high point and still under 14 million square miles.


So, to be clear, I read the graph and reported exactly what it said and you have reviewed it and have called the accurate reporting of the fact that all of the years since 2006-7 show more ice than that winter is not the truth?

Cue the circus music.
 
This is a good recovery of sea ice extant this year. Unfortunately, it is only single year ice. This extent of the ice melt this summer will determine if we have actually seen any recovery of ice. But even this little is a good thing.

We will see what the melt is this summer, and what the clathrates do off the East Siberian Artic Shelf. We need a low melt, and a much lower outgassing than last year. We get a high melt, and an increase in that outgassing, then this winters freeze simply was an anolomy from a double La Nina.


Geee, I wonder what it was like way back in 1959???? Why, looky here! Here is a recollection from a sailor on the USS Skate which surfaced at the North Pole on multiple occasions from 1958 to 1959.


“the Skate found open water both in the summer and following winter. We surfaced near the North Pole in the winter through thin ice less than 2 feet thick. The ice moves from Alaska to Iceland and the wind and tides causes open water as the ice breaks up. The Ice at the polar ice cap is an average of 6-8 feet thick, but with the wind and tides the ice will crack and open into large polynyas (areas of open water), these areas will refreeze over with thin ice. We had sonar equipment that would find these open or thin areas to come up through, thus limiting any damage to the submarine. The ice would also close in and cover these areas crushing together making large ice ridges both above and below the water. We came up through a very large opening in 1958 that was 1/2 mile long and 200 yards wide. The wind came up and closed the opening within 2 hours. On both trips we were able to find open water. We were not able to surface through ice thicker than 3 feet.”

- Hester, James E., Personal email communication, December 2000"


NASA and multi-year Arctic ice and historical context | .....Aaron's EnvironMental Corner.....
 

Forum List

Back
Top