Arctic Ice

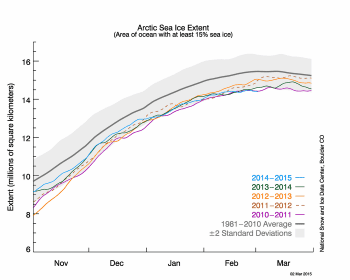
What is interesting about that curve is the appearance that the breakover point has moved back by over two weeks. Should we see that going the other direction this September, we could be looking at a whole new paradigm in the Arctic.

http://arctic.atmos.uiuc.edu/cryosphere/IMAGES/seaice.area.arctic.png

Looking at that data, it appears that the ice delta does not move in a nice linear fashion, but in incremental jumps.
 
Looks like the Arctic Ice is about to start the melt part of the cycle. If if does not gain some in the next two weeks, this will be a record minimum for the maximum.

Arctic sea ice could set an ominous new record this year - The Washington Post

The record to beat here is the year 2011, when the sea ice maximum wasonly 14.63 million square kilometers (5.65 million square miles). Last month the extent was 14.41 million square kilometers.

The trend right now in not good;


Arctic Sea Ice News and Analysis Sea ice data updated daily with one-day lag

You're confusing sea ice and land ice. Sea ice is seasonal and meaningless (except to polar bears.) Land ice is what's melting and contributing to sea level rise.
 
No, I am not confusing the two. Sea ice is very important, for it controls the albedo of the northern tip of the planet. Ice reflects about 90% of incoming energy back to space, open water absorbs over 90% of that energy. On the continental shelves under that water are billions of tons of CH4 in the form of clathrates. Warm that water very much, and those clathrates will release that CH4. That process has already started.

So, an earlier melt, and later freezup means more time for the water to be warmed. And the affect of that open water on the jet stream is something we are already experiancing.


That video was made before the winters of 2014 and 2015.
 
The change in albedo by sea ice is an important question. Data on Arctic sea ice is considerably more available than Antarctic sea ice. Probably because it would be an unwelcome story. Antarctic sea ice is at a lower latitude and therefore has a greater effect per area. While I have seen estimates for certain times of the year (eg the equinoxes) there should be readily available info for the complete year. This is the type of basic research that should be funded but doesn't seem to be. The different shaped shoulders from the Ceres data point to a large effect that should be quantified.
 
So, is this a good thing or a bad thing?

Figure2-350x280.png


Seems to me that the last 10 years has tracked together very well, maybe time for a new average.

With the environ-mental-cases everything is bad.

Hot? Bad. Cold? Bad. Hot then cold? Cold then hot? Average? More rain? Less rain? Snow? No Snow? Bad bad bad
 
That is why they changed the name from global warming to climate change to extreme weather. Every description needs less objective evidence, to the point now where it is unfalsifiable.
 
So, is this a good thing or a bad thing?

Figure2-350x280.png


Seems to me that the last 10 years has tracked together very well, maybe time for a new average.

With the environ-mental-cases everything is bad.

Hot? Bad. Cold? Bad. Hot then cold? Cold then hot? Average? More rain? Less rain? Snow? No Snow? Bad bad bad
So, you cannot discuss the subject with intelligence, just silly flap-yap. Kaz, meet Billy Boob. Billy boob, meet Kaz.
 

Forum List

Back
Top