arctic ice, again

Old Rocks

Diamond Member
Oct 31, 2008
63,085
9,749
2,040
Portland, Ore.
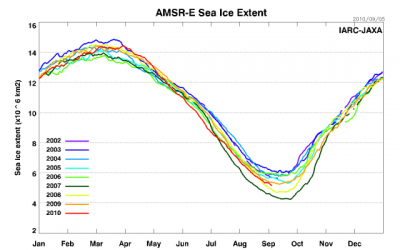
Look at the minimum for this years arctic ice. Almost as low as 2007, and still declining.

http://arctic.atmos.uiuc.edu/cryosphere/IMAGES/seaice.area.arctic.png

Now look at the global sea ice area, note the right hand side of the graph. See how much time the ice area is below the zero line since 2003.

http://arctic.atmos.uiuc.edu/cryosphere/IMAGES/global.daily.ice.area.withtrend.jpg

And here is the present line of the Arctic Ice area

http://nsidc.org/data/seaice_index/images/daily_images/N_stddev_timeseries.png

Still trending down. Another week of no uptrend, and we may well see another low for the Arctic Ice Melt.
 
Here is the trend line from AMSR-E. As you can see we are ABOVE the trend for 2007 and 2008 and slightly below that for 2009.
 

Attachments

  • $jaxa_extent090510.png
    $jaxa_extent090510.png
    21.5 KB · Views: 67
Arctic ice, again:

The Navy requires accurate sea ice information for their operations, and has spent a lot of effort over the years studying, measuring, and operating in Arctic ice both above and below, such as they did in the ICEX 2009 exercise.

800px-USS_Annapolis_ICEX.jpg

The US Navy attack submarine USS Annapolis (SSN 760) rests in the Arctic Ocean after surfacing through three feet of ice during Ice Exercise 2009 on March 21, 2009. The two-week training exercise, which is used to test submarine operability and war-fighting capability in Arctic conditions, also involved the USS Helena (SSN 725), the University of Washington and personnel from the Navy Arctic Submarine Laboratory.


So, if you are planning on bringing a $900 million Los Angeles class submarine through the ice, as the captain might say to the analyst after receiving an ice report: “you’d better be damn sure of the ice thickness before I risk the boat and the crew”.

Below is a blink comparator of U.S. Navy PIPS sea ice forecast data, zoomed to show the primary Arctic ice zone.

pips_anim.gif

The blink map above shows the change in ice thickness from May 27, 2008 to May 27, 2010. As you can see, there has been a large increase in the area of ice more than two metres thick – turquoise, green, yellow and red. Much of the thin (blue and purple) ice has been replaced by thicker ice.

Arctic Ice Volume Has Increased 25% Since May, 2008 | Watts Up With That?
 
Watt's up with your brain, Oddie? Watt is a jerk that has no degree, and lies with facility.

Look at the graphs that I posted links to. Yes, the ice had more volume and area in May10 than in May08. However, right now, it is at or lower than the 2008 minimum. So we had a fast melt since May. As in the Arctic is significantly warmer now than it was in 2008.


And your sources are paragons of virtue?....riiiiight!
 
Arctic sea ice volume heads toward record low as Northwest Passage melts free fourth year in a row Climate Progress

When was the last time the Northwest and Northeast Passages melted free 3 consecutive years?
The first recorded attempt to find and sail the Northwest Passage occurred in 1497, and ended in failure. The thick ice choking the waterways thwarted all attempts at passage for the next four centuries. While we cannot say for certain the Northwest Passage did not open between 1497 and 1900, it is highly unlikely that a string of three consecutive summers where both the Northwest and Northeast Passage opened would have escaped the notice of early mariners and whalers, who were very active in northern waters. We can be sure the Northern Passages were never open between 1900 – 2005, as we have detailed ice edge records from ships (Walsh and Chapman, 2001). A very cold period dominated northern latitudes during the 1600s, 1700s, and 1800s, known as “The Little Ice Age”, further arguing against an opening of the Northern Passages during those centuries. The Northern Passages may have been open at some period during the Medieval Warm Period, between 900 and 1300 AD. Temperatures in Europe were similar, though probably a little cooler, than present-day temperatures. However, the Medieval Warm Period warmth was not global, and it is questionable whether or not sections of the Northern Passages along the Alaskan, Canadian, and Russian shores shared in the warmth of the Medieval Warm Period. So, a better candidate for the last previous multi-year opening of the Northern Passages was the period 6,000 – 8,500 years ago, when the Earth’s orbital variations brought more sunlight to the Arctic in summer than at present. Funder and Kjaer (2007) found extensive systems of wave generated beach ridges along the North Greenland coast that suggested the Arctic Ocean was ice-free in the summer for over 1,000 years during that period. Prior to that, the next likely time the Northern Passages were open was during the last inter-glacial period, 120,000 years ago. Arctic temperatures then were 2 – 3 degrees Centigrade higher than present-day temperatures, and sea levels were 4 – 6 meters higher. It is possible we’ll know better soon. A new technique that examines organic compounds left behind in Arctic sediments by diatoms that live in sea ice give hope that a detailed record of sea ice extent extending back to the end of the Ice Age 12,000 years ago may be possible (Belt et al., 2007). The researchers are studying sediments along the Northwest Passage in hopes of being able to determine when the Passage was last open.
 
Arctic sea ice volume heads toward record low as Northwest Passage melts free fourth year in a row Climate Progress

Chris Mooney has a good piece in New Scientist, “Arctic ice: Less than meets the eye,” the source of the above figures. Mooney focuses on the work of Canada’s David Barber — you can find his peer-reviewed work here: “Where on Earth is it unusually warm? Greenland and the Arctic Ocean, which is full of rotten ice” — New study supports finding that “the amount of [multi-year] sea ice in the northern hemisphere was the lowest on record in 2009.”

Mooney also discusses the PIOMAS ice volume model developed by the University of Washington’s Polar Science Center in Seattle, which I have been featuring on CP this year. Their analysis finds “not only has the total volume of Arctic ice continued to decline since 2007, but that the rate of loss is accelerating” [see also Arctic death spiral: Naval Postgrad School’s Maslowski “projects ice-free* fall by 2016 (+/- 3 yrs)”].

Mooney talks to Michael MacCracken of the Climate Institute who explains how an increasingly ice free Arctic will lead to “more extreme storms and heavy precipitation events in regions not used to them” like the U.S. Great Plains.
 
The other thing that is interesting about the map is the surface area was the same in both projections.
 
Posting up shit about "arctic ice"..........lmao...........these days, you might as well be standing naked in the middle of Siberia shouting "FIRE"!!
I guess the k00ks get off on that shit but politically, its having zero impact these days..........as John Kerry said recently, "Talking about global warming is radioactive"...............


Crap and Tax is dead..........and its because even Democrats conceed, "the energy price tsunami would be coming". Passage of the bill would also amount to the largest single tax increase on Americans in the history of the country.

The Cap and Tax Fiction - WSJ.com


Its like Ive been saying for years..........the environmental asshats have the political IQ of a small soap dish.


So all this talk about ice melting is like an exercise in navel contemplation.
 
Last edited:

Forum List

Back
Top