America’s Most Advanced Climate Station Data Shows US In A 10-Year Cooling Trend Read more: http:

LOLOLOLOLOL......poor deluded and very confused denier cultists....

It is shown to you that most scientists publishing papers about the climate in the 70's were already predicting global warming....and you respond with a video of a newscaster? LOL.

So where's the Katrina force hurricanes,
Here's one, Mr. BullKrap.

Typhoon Haiyan, known in the Philippines as Bagyong Yolanda, was one of the strongest tropical cyclones ever recorded, devastating portions of Southeast Asia, particularly the Philippines, in early-November 2013.[1] It is the deadliest Philippine typhoon recorded in modern history,[2] killing at least 6,300 people in that country alone.[3] Haiyan is also the strongest storm recorded at landfall, and the strongest typhoon ever recorded in terms of one-minute sustained wind speed.[4][5] As of January 2014, bodies were still being found.[6]

After becoming a tropical storm and being given the name Haiyan at 0000 UTC on November 4, the system began a period of rapid intensification that brought it to typhoon intensity by 1800 UTC on November 5. By November 6, the Joint Typhoon Warning Center (JTWC) assessed the system as a Category 5-equivalent super typhoon on the Saffir-Simpson hurricane wind scale; the storm passed over the island of Kayangel in Palau shortly after attaining this strength.

Thereafter, it continued to intensify; at 1200 UTC on November 7, the Japan Meteorological Agency (JMA) upgraded the storm's maximum ten-minute sustained winds to 235 km/h (146 mph; 127 kn), the highest in relation to the cyclone. The Hong Kong Observatory put the storm's maximum ten-minute sustained winds at 285 km/h (177 mph; 154 kn),[7]prior to landfall in the central Philippines, while the China Meteorological Administration estimated the maximum two-minute sustained winds at the time to be around 280 km/h (174 mph; 151 kn). At 1800 UTC, the JTWC estimated the system's one-minute sustained winds to 315 km/h (196 mph; 170 kn), making Haiyan the strongest tropical cyclone ever observed based on one-minute sustained wind speed; several others have recorded lower central pressure readings.[4]Several hours later, the eye of the cyclone made its first landfall in the Philippines at Guiuan, Eastern Samar. Gradually weakening, the storm made five additional landfalls in the country before emerging over the South China Sea. Turning northwestward, the typhoon eventually struck northern Vietnam as a severe tropical storm on November 10. Haiyan was last noted as a tropical depression by the JMA the following day.

The cyclone caused catastrophic destruction in the Visayas, particularly on Samar and Leyte, Cebu, Capiz, Negros, and Northern Iloilo. According to UN officials, about 11 million people have been affected – many have been left homeless.[8]


submerged coastlines, and sunken islands that Fat Albert said would have us by now, asshole?
Sea levels are rising at accelerating rates. Coastlines are being submerged and small island nations are indeed in trouble with coastal erosion and subsidence and saltwater intrusions into their aquifers. These are currently happening and will only get worse as Greenland and Antarctica lose increasing amounts of ice mass into the ocean. No one, including former Vice-President Gore, has ever claimed that any coastlines or islands would already be submerged at this point in time. In the future, yes; by now, no. You are the victim of the deliberately fraudulent denier cult myths that the fossil fuel industry propagandists have spoon-fed into your gullible little brain.
 
LOLOLOLOLOL......poor deluded and very confused denier cultists....

It is shown to you that most scientists publishing papers about the climate in the 70's were already predicting global warming....and you respond with a video of a newscaster? LOL.

So where's the Katrina force hurricanes,
Here's one, Mr. BullKrap.

Typhoon Haiyan, known in the Philippines as Bagyong Yolanda, was one of the strongest tropical cyclones ever recorded, devastating portions of Southeast Asia, particularly the Philippines, in early-November 2013.[1] It is the deadliest Philippine typhoon recorded in modern history,[2] killing at least 6,300 people in that country alone.[3] Haiyan is also the strongest storm recorded at landfall, and the strongest typhoon ever recorded in terms of one-minute sustained wind speed.[4][5] As of January 2014, bodies were still being found.[6]

After becoming a tropical storm and being given the name Haiyan at 0000 UTC on November 4, the system began a period of rapid intensification that brought it to typhoon intensity by 1800 UTC on November 5. By November 6, the Joint Typhoon Warning Center (JTWC) assessed the system as a Category 5-equivalent super typhoon on the Saffir-Simpson hurricane wind scale; the storm passed over the island of Kayangel in Palau shortly after attaining this strength.

Thereafter, it continued to intensify; at 1200 UTC on November 7, the Japan Meteorological Agency (JMA) upgraded the storm's maximum ten-minute sustained winds to 235 km/h (146 mph; 127 kn), the highest in relation to the cyclone. The Hong Kong Observatory put the storm's maximum ten-minute sustained winds at 285 km/h (177 mph; 154 kn),[7]prior to landfall in the central Philippines, while the China Meteorological Administration estimated the maximum two-minute sustained winds at the time to be around 280 km/h (174 mph; 151 kn). At 1800 UTC, the JTWC estimated the system's one-minute sustained winds to 315 km/h (196 mph; 170 kn), making Haiyan the strongest tropical cyclone ever observed based on one-minute sustained wind speed; several others have recorded lower central pressure readings.[4]Several hours later, the eye of the cyclone made its first landfall in the Philippines at Guiuan, Eastern Samar. Gradually weakening, the storm made five additional landfalls in the country before emerging over the South China Sea. Turning northwestward, the typhoon eventually struck northern Vietnam as a severe tropical storm on November 10. Haiyan was last noted as a tropical depression by the JMA the following day.

The cyclone caused catastrophic destruction in the Visayas, particularly on Samar and Leyte, Cebu, Capiz, Negros, and Northern Iloilo. According to UN officials, about 11 million people have been affected – many have been left homeless.[8]


submerged coastlines, and sunken islands that Fat Albert said would have us by now, asshole?
Sea levels are rising at accelerating rates. Coastlines are being submerged and small island nations are indeed in trouble with coastal erosion and subsidence and saltwater intrusions into their aquifers. These are currently happening and will only get worse as Greenland and Antarctica lose increasing amounts of ice mass into the ocean. No one, including former Vice-President Gore, has ever claimed that theses things would have already happened by now. You are the victim of your deliberately fraudulent denier cult myths.

Only took ya half an hour to find one of each...way to go Skippy....now run along and see if you can find another one....which btw had nothing to do with "climate-change" since typhoons have been around for millions of years as have disappearing atolls that popped up from undersea earthquakes.
 
So where's the Katrina force hurricanes?
Here's one, Mr. BullKrap.

Typhoon Haiyan, known in the Philippines as Bagyong Yolanda, was one of the strongest tropical cyclones ever recorded, devastating portions of Southeast Asia, particularly the Philippines, in early-November 2013.[1] It is the deadliest Philippine typhoon recorded in modern history,[2] killing at least 6,300 people in that country alone.[3] Haiyan is also the strongest storm recorded at landfall, and the strongest typhoon ever recorded in terms of one-minute sustained wind speed.[4][5] As of January 2014, bodies were still being found.[6]

After becoming a tropical storm and being given the name Haiyan at 0000 UTC on November 4, the system began a period of rapid intensification that brought it to typhoon intensity by 1800 UTC on November 5. By November 6, the Joint Typhoon Warning Center (JTWC) assessed the system as a Category 5-equivalent super typhoon on the Saffir-Simpson hurricane wind scale; the storm passed over the island of Kayangel in Palau shortly after attaining this strength.

Thereafter, it continued to intensify; at 1200 UTC on November 7, the Japan Meteorological Agency (JMA) upgraded the storm's maximum ten-minute sustained winds to 235 km/h (146 mph; 127 kn), the highest in relation to the cyclone. The Hong Kong Observatory put the storm's maximum ten-minute sustained winds at 285 km/h (177 mph; 154 kn),[7]prior to landfall in the central Philippines, while the China Meteorological Administration estimated the maximum two-minute sustained winds at the time to be around 280 km/h (174 mph; 151 kn). At 1800 UTC, the JTWC estimated the system's one-minute sustained winds to 315 km/h (196 mph; 170 kn), making Haiyan the strongest tropical cyclone ever observed based on one-minute sustained wind speed; several others have recorded lower central pressure readings.[4]Several hours later, the eye of the cyclone made its first landfall in the Philippines at Guiuan, Eastern Samar. Gradually weakening, the storm made five additional landfalls in the country before emerging over the South China Sea. Turning northwestward, the typhoon eventually struck northern Vietnam as a severe tropical storm on November 10. Haiyan was last noted as a tropical depression by the JMA the following day.

The cyclone caused catastrophic destruction in the Visayas, particularly on Samar and Leyte, Cebu, Capiz, Negros, and Northern Iloilo. According to UN officials, about 11 million people have been affected – many have been left homeless.[8]
Only took ya half an hour to find one of each...way to go Skippy....now run along and see if you can find another one....which btw had nothing to do with "climate-change" since typhoons have been around for millions of years as have disappearing atolls that popped up from undersea earthquakes.

Mr. BullKrap asked a question, a very dumb question, about Katrina strength hurricanes, that has nothing to do with the scientific evidence supporting AGW/CC BTW, and I pointed out that the strongest such storm in recorded history occured in 2013. Mr. BullKrap is unable to comprehend what fraudulent bullshit his denier cult myths are, so he clings to them no matter how many times they are debunked.
 
Mr. BullKrap asked a question, a very dumb question, about Katrina strength hurricanes, that has nothing to do with the scientific evidence supporting AGW/CC BTW, and I pointed out that the strongest such storm in recorded history occured in 2013. Mr. BullKrap is unable to comprehend what fraudulent bullshit his denier cult myths are, so he clings to them no matter how many times they are debunked.

Hey zombie....you post like a spoiled brat who thinks you're on the "cutting edge" of some new disaster discovery that could end the world... The truth is you're being played by rich leftists who've invested in "alternative energy" and lying through their crooked teeth to you. You'll look back on this someday and wonder how you could have been so gullible. :eusa_doh:
 
Mr. BullKrap asked a question, a very dumb question, about Katrina strength hurricanes, that has nothing to do with the scientific evidence supporting AGW/CC BTW, and I pointed out that the strongest such storm in recorded history occured in 2013. Mr. BullKrap is unable to comprehend what fraudulent bullshit his denier cult myths are, so he clings to them no matter how many times they are debunked.
Hey zombie....you post like a spoiled brat who thinks you're on the "cutting edge" of some new disaster discovery that could end the world... The truth is you're being played by rich leftists who've invested in "alternative energy" and lying through their crooked teeth to you. You'll look back on this someday and wonder how you could have been so gullible.

Poor Mr. BullKrap has nothing real to support his denier cult delusions so he is reduced to spluttering fatuously and projecting his own gullibility.
What do you mean by real?
"By real", I mean science (physics, chemistry, etc.), scientific evidence or data, observable facts, like the polar ice melting fast or the seasons changing timing or the sea levels rising at accelerating rates, etc.....all the stuff that you denier cultists don't have and try to replace with your fraudulent myths, crackpot conspiracy theories and anti-science demented twaddle.
And you think you have real Science but can't provide any evidence. Hmmm seems that makes you a hypocrite!
 
"By real", I mean science (physics, chemistry, etc.), scientific evidence or data, observable facts, like the polar ice melting fast or the seasons changing timing or the sea levels rising at accelerating rates, etc.....all the stuff that you denier cultists don't have and try to replace with your fraudulent myths, crackpot conspiracy theories and anti-science demented twaddle.

Hey pissant: :badgrin:

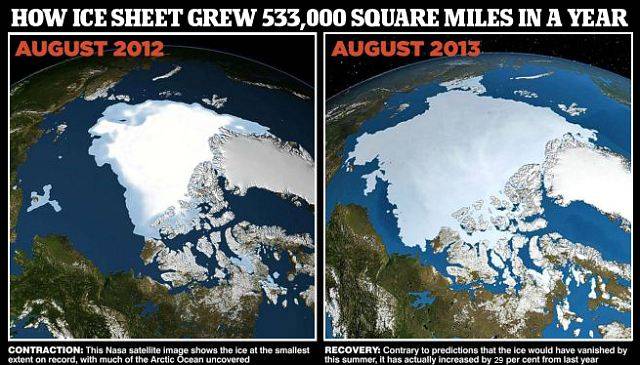
article-2415191-185A43E400000578-982_640x365.jpg
 
Oh my, grew over one and one quarter million square kilometers, didn't it. From about 2 and one quarter million square kilometers in 2012, to a whole three and one half square kilometers in 2013. Of course, from 1979 to 1989, it was mostly over 5 million square kilometers, and since 2007, it has been mostly below 3 and one half square kilometers, down to two and one quarter kilometers in 2012.

http://arctic.atmos.uiuc.edu/cryosphere/IMAGES/seaice.area.arctic.png

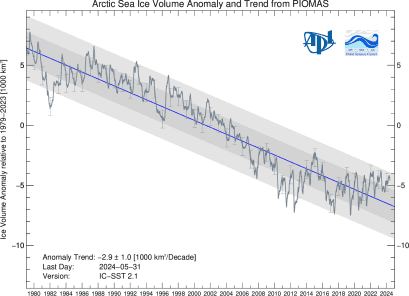
In the meantime there has also been and even greater diminishment of the volume of sea ice;


Fig.1 Arctic sea ice volume anomaly from PIOMAS updated once a month. Daily Sea Ice volume anomalies for each day are computed relative to the 1979 to 2014 average for that day of the year. Tickmarks on time axis refer to 1st day of year. The trend for the period 1979- present is shown in blue. Shaded areas show one and two standard deviations from the trend. Error bars indicate the uncertainty of the monthly anomaly plotted once per year.

Polar Science Center PIOMAS Arctic Sea Ice Volume Reanalysis

Mr. BullKurtz, instead of mindlessly repeating the flapyap of 'Conservatives', perhaps you should do a little research for yourself. If you are not to lazy to do so.
 
Mr. BullKurtz, instead of mindlessly repeating the flapyap of 'Conservatives', perhaps you should do a little research for yourself. If you are not to lazy to do so.

My figures are from a chastened NASA....yours are from a couple hippies in a kayak who were later eaten by one of the disappearing polar bears. :cool-45:
 
Oh my, grew over one and one quarter million square kilometers, didn't it. From about 2 and one quarter million square kilometers in 2012, to a whole three and one half square kilometers in 2013. Of course, from 1979 to 1989, it was mostly over 5 million square kilometers, and since 2007, it has been mostly below 3 and one half square kilometers, down to two and one quarter kilometers in 2012.

http://arctic.atmos.uiuc.edu/cryosphere/IMAGES/seaice.area.arctic.png

In the meantime there has also been and even greater diminishment of the volume of sea ice;


Fig.1 Arctic sea ice volume anomaly from PIOMAS updated once a month. Daily Sea Ice volume anomalies for each day are computed relative to the 1979 to 2014 average for that day of the year. Tickmarks on time axis refer to 1st day of year. The trend for the period 1979- present is shown in blue. Shaded areas show one and two standard deviations from the trend. Error bars indicate the uncertainty of the monthly anomaly plotted once per year.

Polar Science Center PIOMAS Arctic Sea Ice Volume Reanalysis

Mr. BullKurtz, instead of mindlessly repeating the flapyap of 'Conservatives', perhaps you should do a little research for yourself. If you are not to lazy to do so.
It's funny the increase this year higher than 2009. That's not decreasing is it?
 
Mr. BullKurtz, instead of mindlessly repeating the flapyap of 'Conservatives', perhaps you should do a little research for yourself. If you are not to lazy to do so.

My figures are from a chastened NASA....yours are from a couple hippies in a kayak who were later eaten by one of the disappearing polar bears. :cool-45:
OK, Mr. BullKurtz, now that you have proven yourself a complete liar, here are the sources.

Piomas;

Polar Science Center ABOUT

ABOUT

The Polar Science Center conducts basic and applied research on the oceanography, climatology, meteorology, biology and ecology of the ice-covered regions on Earth and elsewhere in our solar system . The scope of PSC research and fieldwork includes the Arctic and the Antarctic, as well as sea-ice, glaciers and continental ice sheets. The PSC staff comprises 20 Principal Investigators, 7 support staff and a varying number of post-doctoral research associates, graduate research assistants, and undergraduate student helpers.

Most of the funding for PSC’s research comes from grants and contracts with U.S. Federal agencies such as NSF, NASA, NOAA and ONR. A large fraction of PSC research addresses the relationships between the polar regions and the global climate system. Specifically, our researchincludes observing and modeling the physical processes that control the nature and distribution of sea-ice, the structure and circulation of high latitude oceans and atmosphere, and the interactions among air, ocean, ice and biota.

The Polar Science Center is a department within the Applied Physics Laboratory at the University of Washington.

Cryosphere today;


title.img.png

DAS Home Page Polar Research Group UIUC Home Page

If you learned to do a little research before flapping your yap, perhaps you would not come across as such a dumb ass.
 
Oh my, grew over one and one quarter million square kilometers, didn't it. From about 2 and one quarter million square kilometers in 2012, to a whole three and one half square kilometers in 2013. Of course, from 1979 to 1989, it was mostly over 5 million square kilometers, and since 2007, it has been mostly below 3 and one half square kilometers, down to two and one quarter kilometers in 2012.

http://arctic.atmos.uiuc.edu/cryosphere/IMAGES/seaice.area.arctic.png

In the meantime there has also been and even greater diminishment of the volume of sea ice;


Fig.1 Arctic sea ice volume anomaly from PIOMAS updated once a month. Daily Sea Ice volume anomalies for each day are computed relative to the 1979 to 2014 average for that day of the year. Tickmarks on time axis refer to 1st day of year. The trend for the period 1979- present is shown in blue. Shaded areas show one and two standard deviations from the trend. Error bars indicate the uncertainty of the monthly anomaly plotted once per year.

Polar Science Center PIOMAS Arctic Sea Ice Volume Reanalysis

Mr. BullKurtz, instead of mindlessly repeating the flapyap of 'Conservatives', perhaps you should do a little research for yourself. If you are not to lazy to do so.
It's funny the increase this year higher than 2009. That's not decreasing is it?
Lordy, lordy, always have to prove how ridiculous you can be, don't you, Mr. jc? Note that the graph line is not a nice smooth one, many ups and downs. But the trend for the last 40 years is down, and will continue to be with the normal variations.
 
Mr. BullKurtz, instead of mindlessly repeating the flapyap of 'Conservatives', perhaps you should do a little research for yourself. If you are not to lazy to do so.

My figures are from a chastened NASA....yours are from a couple hippies in a kayak who were later eaten by one of the disappearing polar bears.

Your "figures" are pulled out of your ass, Mr. BullKrap, or the ass of some propaganda pusher for the fossil fuel industry.

Seriously!

Just try to show us any actual NASA data to support your fraudulent and very idiotic claims about some non-existent upward trend in Arctic sea ice. Post the link, liar.

Here's a link to what NASA actually observes about the loss of Arctic sea ice.

And this spring...

Arctic sea ice reaches lowest maximum extent on record
NSIDC
March 19th, 2015

On February 25, 2015, Arctic sea ice extent appeared to have reached its annual maximum extent, marking the beginning of the sea ice melt season. This year’s maximum extent not only occurred early; it is also the lowest in the satellite record.
 
Last edited:
Mr. jc454, the truth is not in you. The scientists from around the world have spoken with a unanimous voice, and they have said we are warming, too rapidly, and that will create a precarious future not only for many humans but also for the other species on this planet.
And the best scientists, in the 70s, said we were on the brink of the next ice age.

Nope! They weren't. You're parroting a thoroughly debunked denier cult myth and propaganda meme that has no real basis in reality. The large majority of scientists studying the climate in the 1970's were far more concerned about global warming. This is revealed in the scientific literature of that era.

The Myth of the 1970s Global Cooling Scientific Consensus
Bulletin of the American Meteorological Society

Vol. 89: Issue. 9: Pages. 1325-1337
(Volume publication date: September 2008)
DOI: 10.1175/2008BAMS2370.1

Thomas C. Peterson , William M. Connolley and John Fleck

Abstract
Climate science as we know it today did not exist in the 1960s and 1970s. The integrated enterprise embodied in the Nobel Prizewinning work of the Intergovernmental Panel on Climate Change existed then as separate threads of research pursued by isolated groups of scientists. Atmospheric chemists and modelers grappled with the measurement of changes in carbon dioxide and atmospheric gases, and the changes in climate that might result. Meanwhile, geologists and paleoclimate researchers tried to understand when Earth slipped into and out of ice ages, and why. An enduring popular myth suggests that in the 1970s the climate science community was predicting “global cooling” and an “imminent” ice age, an observation frequently used by those who would undermine what climate scientists say today about the prospect of global warming. A review of the literature suggests that, on the contrary, greenhouse warming even then dominated scientists' thinking as being one of the most important forces shaping Earth's climate on human time scales. More importantly than showing the falsehood of the myth, this review describes how scientists of the time built the foundation on which the cohesive enterprise of modern climate science now rests.


View PDF (4234 KB)
AMS Journals © 2015

Thomas C. Peterson , William M. Connolley and John Fleck

All three are revisionists and liars... My God man these people are the bottom of the proverbial barrel, the shit barrel.. They are right in there with Mann , Hansen, among many others.

Cough, Cough William Connley (fucktard revisionist banned from wiki) well known liar!!!
 
Oh my, grew over one and one quarter million square kilometers, didn't it. From about 2 and one quarter million square kilometers in 2012, to a whole three and one half square kilometers in 2013. Of course, from 1979 to 1989, it was mostly over 5 million square kilometers, and since 2007, it has been mostly below 3 and one half square kilometers, down to two and one quarter kilometers in 2012.

http://arctic.atmos.uiuc.edu/cryosphere/IMAGES/seaice.area.arctic.png

In the meantime there has also been and even greater diminishment of the volume of sea ice;


Fig.1 Arctic sea ice volume anomaly from PIOMAS updated once a month. Daily Sea Ice volume anomalies for each day are computed relative to the 1979 to 2014 average for that day of the year. Tickmarks on time axis refer to 1st day of year. The trend for the period 1979- present is shown in blue. Shaded areas show one and two standard deviations from the trend. Error bars indicate the uncertainty of the monthly anomaly plotted once per year.

Polar Science Center PIOMAS Arctic Sea Ice Volume Reanalysis

Mr. BullKurtz, instead of mindlessly repeating the flapyap of 'Conservatives', perhaps you should do a little research for yourself. If you are not to lazy to do so.
It's funny the increase this year higher than 2009. That's not decreasing is it?
Lordy, lordy, always have to prove how ridiculous you can be, don't you, Mr. jc? Note that the graph line is not a nice smooth one, many ups and downs. But the trend for the last 40 years is down, and will continue to be with the normal variations.
By how much? Let's see this figure from the graph you provided?
 
Mr. BullKurtz, instead of mindlessly repeating the flapyap of 'Conservatives', perhaps you should do a little research for yourself. If you are not to lazy to do so.

My figures are from a chastened NASA....yours are from a couple hippies in a kayak who were later eaten by one of the disappearing polar bears.

Your "figures" are pulled out of your ass, Mr. BullKrap, or the ass of some propaganda pusher for the fossil fuel industry.

Seriously!

Just try to show us any actual NASA data to support your fraudulent and very idiotic claims about some non-existent upward trend in Arctic sea ice. Post the link, liar.

Here's a link to what NASA actually observes about the loss of Arctic sea ice.
Old crock already did. Looking at it above 2009 levels
 
Mr. jc454, the truth is not in you. The scientists from around the world have spoken with a unanimous voice, and they have said we are warming, too rapidly, and that will create a precarious future not only for many humans but also for the other species on this planet.
And the best scientists, in the 70s, said we were on the brink of the next ice age.

Nope! They weren't. You're parroting a thoroughly debunked denier cult myth and propaganda meme that has no real basis in reality. The large majority of scientists studying the climate in the 1970's were far more concerned about global warming. This is revealed in the scientific literature of that era.

The Myth of the 1970s Global Cooling Scientific Consensus
Bulletin of the American Meteorological Society

Vol. 89: Issue. 9: Pages. 1325-1337
(Volume publication date: September 2008)
DOI: 10.1175/2008BAMS2370.1

Thomas C. Peterson , William M. Connolley and John Fleck

Abstract
Climate science as we know it today did not exist in the 1960s and 1970s. The integrated enterprise embodied in the Nobel Prizewinning work of the Intergovernmental Panel on Climate Change existed then as separate threads of research pursued by isolated groups of scientists. Atmospheric chemists and modelers grappled with the measurement of changes in carbon dioxide and atmospheric gases, and the changes in climate that might result. Meanwhile, geologists and paleoclimate researchers tried to understand when Earth slipped into and out of ice ages, and why. An enduring popular myth suggests that in the 1970s the climate science community was predicting “global cooling” and an “imminent” ice age, an observation frequently used by those who would undermine what climate scientists say today about the prospect of global warming. A review of the literature suggests that, on the contrary, greenhouse warming even then dominated scientists' thinking as being one of the most important forces shaping Earth's climate on human time scales. More importantly than showing the falsehood of the myth, this review describes how scientists of the time built the foundation on which the cohesive enterprise of modern climate science now rests.


View PDF (4234 KB)
AMS Journals © 2015

Thomas C. Peterson , William M. Connolley and John Fleck

All three are revisionists and liars... My God man these people are the bottom of the proverbial barrel, the shit barrel.. They are right in there with Mann , Hansen, among many others.

Cough, Cough William Connley (fucktard revisionist banned from wiki) well known liar!!!

So, it is above 2009 levels, and will be below that trend line again in the near future. And eventually will hit zero in September. Well before 2100.
 

Forum List

Back
Top