Freewill
Platinum Member
- Oct 26, 2011
- 31,158
- 5,072
- 1,130
- Thread starter
- #21
The response is going to be that the US is not the world, only a small part. But consider what would be said if things were reversed. If the data shown indicated that the US was warming and the rest of the world was cooling. Those who seem to think we can do something about the climate would be saying that the US has the best equipment thus we have to believe the US data. Well I agree.
Go here to see the actual NOAA data:
National Temperature Index National Centers for Environmental Information NCEI
From the linked article:
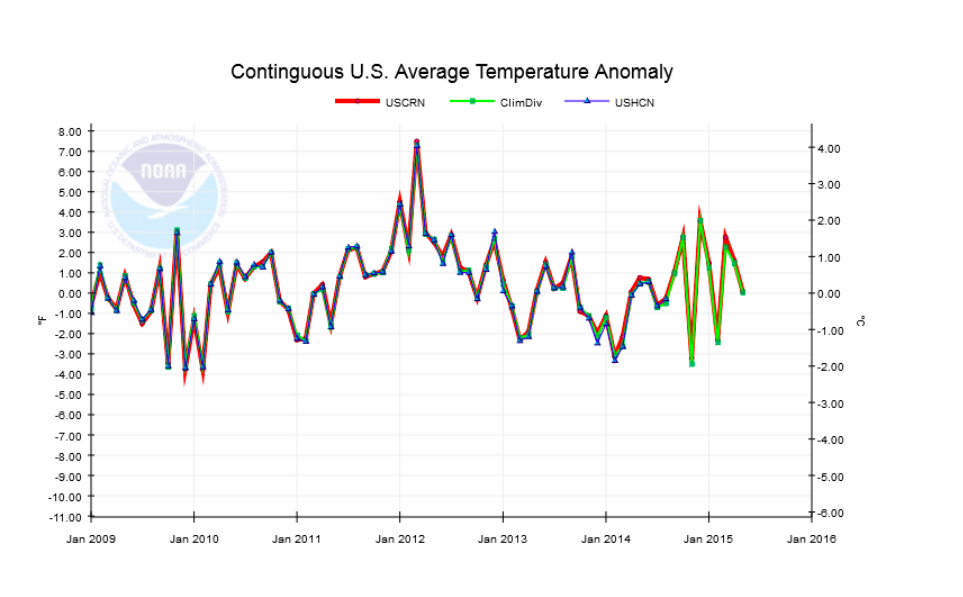
Data from America’s most advanced climate monitoring system shows the U.S. has undergone a cooling trend over the last decade, despite recent claims by government scientists that warming has accelerated worldwide during that time.
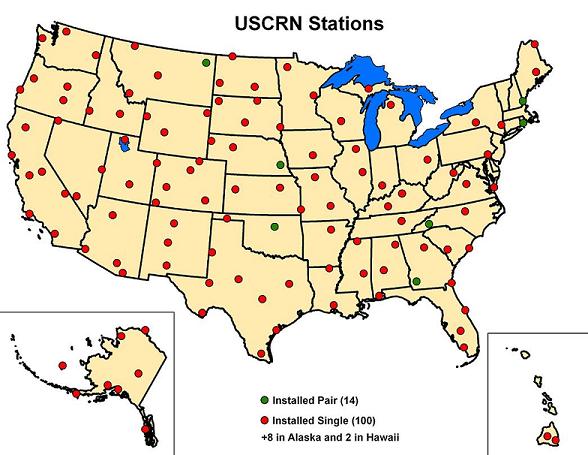
The U.S. Climate Reference Network was developed by the National Oceanic and Atmospheric Administration (NOAA) to provide “high-quality” climate data. The network consists of 114 stations across the U.S. in areas NOAA expects no development for the next 50 to 100 years.
Read more: Advanced Climate Station Data Shows U.S. In A Cooling Trend The Daily Caller
The usual denier cult pseudo-science and deliberately twisted facts, sourced from fraudulent denier cult blogs.
For a good explanation of the lies in the OP, check this out...
The Daily Caller's Bad Science on 'Global Cooling'
Newsweek
BY ZOË SCHLANGER
6/18/15
(excerpts)
First of all, the data does not show a cooling trend. Second of all, even if it did (which it doesn’t!), it wouldn’t be proof that the globe is indeed in a global warming “pause,” which is the secondary argument of the article.
"It is a favorite tactic of those who resist climate regulation to cherry-pick data from limited time periods and limited geographical areas to draw broad conclusions that are contrary to the overwhelming body of climate science," says Michael Gerrard, a law professor and director of the Sabin Center for Climate Change Law at Columbia University.
***
A. I did not cherry pick data
B. I provided a very neutral site and provide a link to that site.
C. Quoting a quote is not much of an argument.