Americans 2.45 Trillion Dollars POORER in 3Q

likeabird03

Active Member
Oct 10, 2011
413
61
28
Sacramento
Bloomberg: "Household Wealth in U.S. Falls for Second Straight Quarter."

Household Wealth in U.S. Falls for Second Straight Quarter - Businessweek

As you can see the other thread is a just a tad out of date.

"By Timothy R. Homan
(Updates with details on financial assets starting in eighth paragraph.)

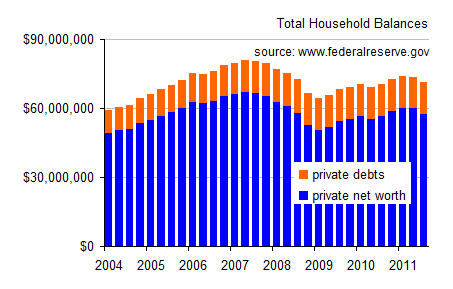
Dec. 8 (Bloomberg) -- Household wealth in the U.S. fell from July through September for a second straight quarter as the European debt crisis depressed stocks and home values decreased.

Net worth for households and non-profit groups decreased by $2.45 trillion to $57.4 trillion, the Federal Reserve said today in its flow of funds report from Washington. Americans reduced debt in the third quarter, extending a string of declines dating back three years.

A 14 percent slump in the Standard & Poor’s 500 Index, the worst quarter since 2008, combined with another decrease in households’ real estate values in the third quarter. A rebound in stocks at the end of this year and slower home-price declines may help stabilize Americans’ balance sheets at the same time employment growth picks up.

“We’re kind of in the third inning of the consumer deleveraging at this point,” Guy LeBas, chief fixed-income strategist at Janney Montgomery Scott LLC in Philadelphia, said before the report. “Job growth suggests that we’ll see some pace of increases in consumer income.”

The value of household real estate decreased by $98.3 billion in the third quarter after dropping by $37 billion in the previous three months.

Owners’ equity as a share of total household real-estate holdings was little changed at 38.7 percent last quarter, today’s report showed.

Mortgages Outstanding

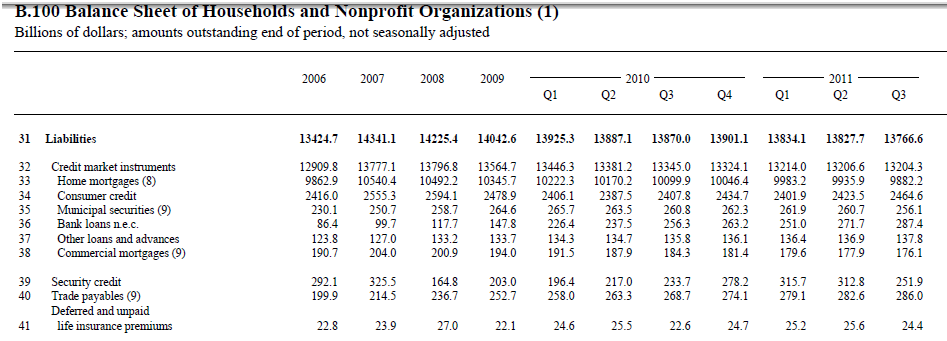
The volume of outstanding home mortgages was $9.93 trillion at the end of the second quarter, the lowest since the end of 2006, according to separate Federal Reserve data. That means U.S. mortgage debt, a driver of consumer spending during the real estate boom, may be about to enter its fourth year of decline as foreclosures wipe out home loans and housing purchases fall.

The value of financial assets, including stocks and pension fund holdings, held by American households decreased by $2.78 trillion in the third quarter, according to the flow of funds data.

Household debt dropped at a 1.2 percent annual rate last quarter. Mortgage borrowing decreased at a 1.8 percent pace. Other forms of consumer credit, including auto and student loans, increased at a 1.2 percent pace.

Labor Market

Americans are reducing debt and rebuilding savings to weather an unemployment rate that has averaged 9 percent this year. Payrolls climbed by 120,000 in November and the jobless rate fell to 8.6 percent, the lowest level since March 2009, the Labor Department said on Dec. 2.

Ahead of the holiday shopping season, consumers were limiting their expenditures. Household spending slowed to a 0.1 percent gain in October, the smallest since a 0.2 percent drop in June, according to Commerce Department data.

Today’s report also showed the balance sheets of businesses are faring better relative to households. Companies had $2.11 trillion in cash and other liquid assets at the end of the third quarter, up from $2.07 trillion in the prior three months.

Total non-financial debt last quarter rose at a 4.3 percent annual pace, led by a 14.1 percent increase by the federal government and a 3.5 percent gain among businesses. State and local government borrowing was little changed.

--Editors: Carlos Torres, Vince Golle
 
...Americans reduced debt in the third quarter, extending a string of declines dating back three years...
--even while America's federal government's debt soars. What's significant here is the fact that total net worth has fallen two quarters in a row--
totbals.png

--and the last time that happened we got hit with some pretty serious economic shocks.

I read another article about it but it was proprietary. It stated that the majority of the reduction in debt was actually due to charge-offs and not actually from the paying down of debt.
 
...I read another article about it but it was proprietary. It stated that the majority of the reduction in debt was actually due to charge-offs and not actually from the paying down of debt.
Hmm sounds like the liars at the Wall Street Journal but whoever it was we now live in an age where we're all free to look at the Flow of Funds--
ssliabffs.png

--and see how third quarter's private debt's now $13,766.6 billion, down $61.1 billion. Then we can look for ourselves at the total charge offs of all debt with all banks--
sschoffs.png

--and see not only that the third quarter total was less than one seventh that number, but also how charge-offs like debt have been falling. Maybe if lying is what's needed to get econ articles published then I need to tell the WSJ about my three Nobel prizes in economics...

Charge-offs have come down considerably, partly because many bad debts have been purged from the system, and partly because of a lot of moratorium on foreclosures in the past year or so, this means that there's still a huge shadow inventory of homes that aren't showing up in the numbers.

That being said the rate of charge-offs spikes very very high between 2008 and 2010 according to that graph, so it does account for why the amount of outstanding debt fell during this time somewhat, and why the rate of decline in debt has slowed in the past few quarters.

Either way I don't think we're talking about an earth-shattering phenomenon here, debt is still above even it's 2006 levels. It's also important to note that the size of each mortgage being originated now compared to the mid 2000's is far lower due to the decline in home prices, and that also has an effect on the amount of consumer debt outstanding.
 
...don't think we're talking about an earth-shattering phenomenon here, debt is still above even it's 2006 levels...
Reducing debt can be bad if we drop assets more. Right now we've got a trillion dollars less debt than we did in the beginning of '08 when we had seven trillion dollars more in assets. We paid off a trillion in debt and we're six trillion poorer. Not good.

That's because asset prices fell far more than debt levels, such as home prices and stock prices. I would agree that in this economy a drop in debt is probably a sign of something problematic going on however.
 
Granny say purt soon dem Asiatics gonna own us lock, stock anna Statue o' Liberty...
:eek:
Japanese Holdings of U.S. Government Debt Top $1T for First Time
January 20, 2012 - Japanese holdings of U.S. government debt have topped $1 trillion dollars for the first time, according to data released this week by the U.S. Treasury Department.
Entities in Japan held $1.0389 trillion in U.S. Treasury securities as of the end of November, according to the Treasury. That was up from the $979 billion in U.S. Treasury securities that the Japanese held at the end of October. China is now the only nation other than Japan where entities hold more than $1 trillion in U.S. government debt. As of the end of November, according to the latest Treasury data, the Chinese held $1.1326 trillion in U.S. Treasury securities. That was down from the $1.1341 trillion in U.S. Treasury securities the Chinese held at the end of October.

As little as a decade ago--at the end of November 2001--the Japanese held only $315.4 billion in U.S. government debt, according to historical Treasury Department data. At that time, Japan was the No. 1 foreign owner of U.S. debt, exceeding Mainland China, which then was the No. 2 holder of U.S. government debt with only $77.9 billion in holdings. Individually, both the Japanese and the Chinese now own more U.S. government debt than all foreign entities combined did a decade ago. In fact, over the past decade, overall foreign ownership of U.S. debt has skyrocketed from $1.0363 trillion as of the end of November 2001 to $4.7509 trillion as of the end of November 2011. That is an increase of $3.7146 trillion--or 279 percent.

Between January 2009, when Barack Obama became the U.S. president, and the end of November 2011, Japanese holdings of U.S. debt climbed 63.7 percent, rising from $634.8 billion to $1.0389 trillion. During the same period, Chinese holdings of U.S. debt climbed $739.6 billion to $1.1326, an increase of 53.1 percent. While Japanese holdings of U.S. Treasury securities have climbed rather steadily over the past three years, Chinese holdings actually peaked at $1.1753 in October 2010 and declined in 8 of the 13 months between then and November 2011.

In recent times, the Chinese have dramatically decreased their holdings U.S. Treasury bills, which are short-term debt instruments that mature in one year or less. Chinese ownership of T-bills peaked at $210.407 billion at the end of May 2009 and dropped to $2.336 billion by the end of November 2011. That represents a 99 percent (98.88) decline in Chinese ownership of T-bills. As of the end of November, according to the Treasury, the average interest rate on T-bills was only 0.076 percent compared to an average interest rate of 5.691 percent on long-term Treasury bonds. As of the end of November, there was only one entity that owned more U.S. debt than either the Chinese or the Japanese. That was the Federal Reserve. According to the Federal Reserve’s January 2012 monthly report, it owned $1.672 trillion in U.S. government debt as of the end of November, making it the single largest holder of U.S. government debt.

MORE
 

Forum List

Back
Top