Sunsettommy
Diamond Member
- Mar 19, 2018
- 14,894
- 12,528
- 2,400
All trolling, name calling comments WILL be reported, I seek honest factual counterpoints to the article.
Acresearch
Alarmist Claim Rebuttals
May 20, 2019
Joseph D'Aleo, CCM, AMS Fellow
EXCERPT:
Alarmist Claim Rebuttal Overview[1]
Below are a series of rebuttals of the 11 most common climate alarmists’ claims such as those made in the recently released Fourth National Climate Assessment Report.[2] The authors of these rebuttals are all recognized experts in the relevant
For each alarmist claim, a summary of the relevant rebuttal is provided below along with a link to the full text of the rebuttal, which includes the names and the credentials of the authors of each rebuttal.
LINK for the rest
Acresearch
Alarmist Claim Rebuttals
May 20, 2019
Joseph D'Aleo, CCM, AMS Fellow
EXCERPT:
Alarmist Claim Rebuttal Overview[1]
Below are a series of rebuttals of the 11 most common climate alarmists’ claims such as those made in the recently released Fourth National Climate Assessment Report.[2] The authors of these rebuttals are all recognized experts in the relevant
For each alarmist claim, a summary of the relevant rebuttal is provided below along with a link to the full text of the rebuttal, which includes the names and the credentials of the authors of each rebuttal.
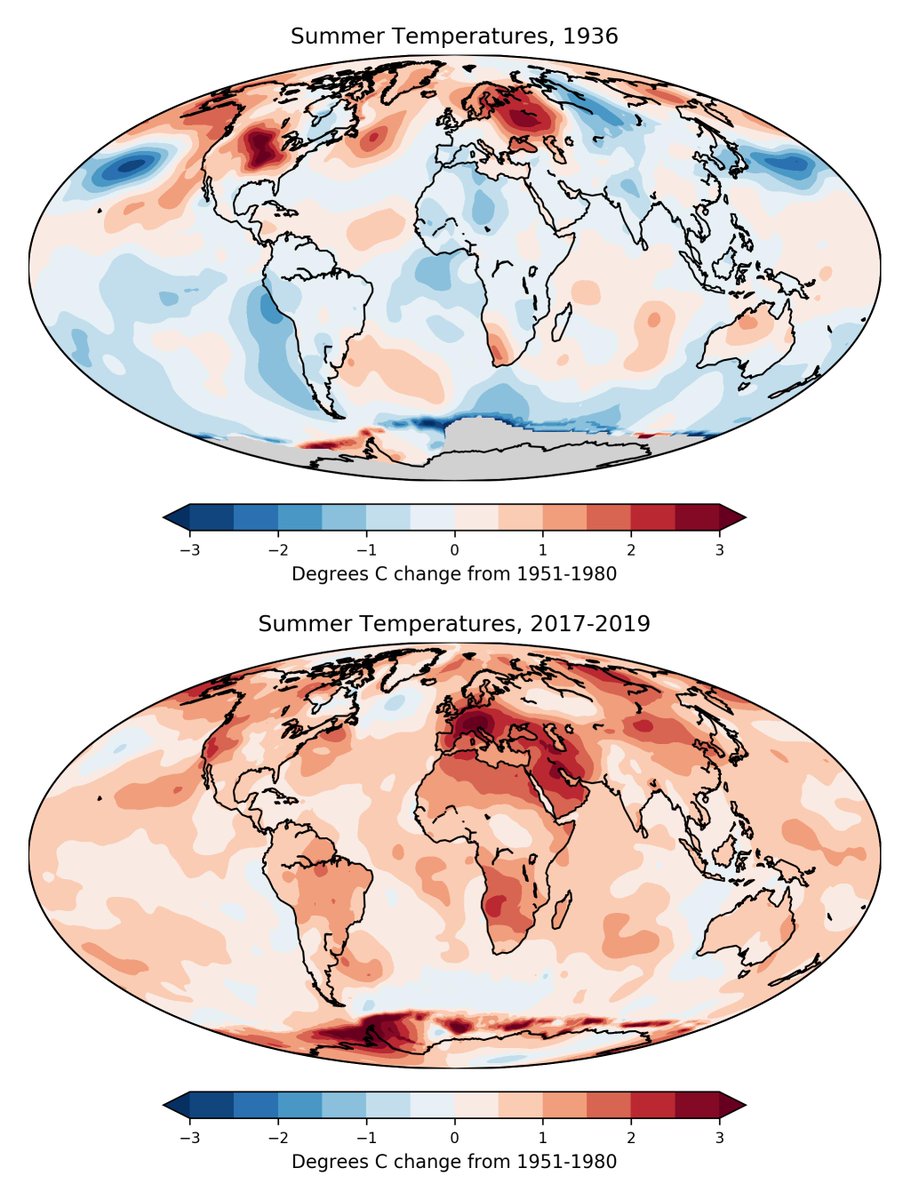
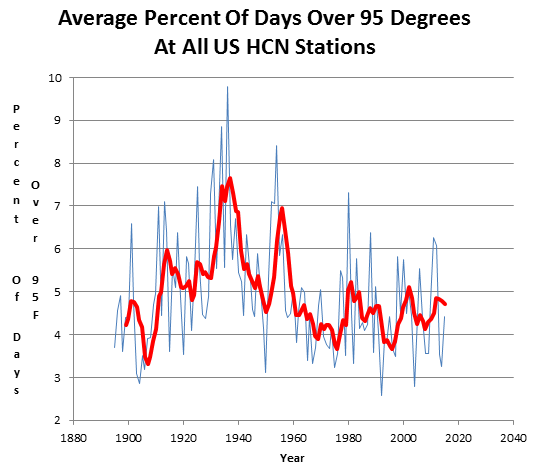
- Heat Waves – have been decreasing since the 1930s in the U.S. and globally
- Hurricanes – hurricane activity is flat to down since 1900, landfalls in the US are declining
- Tornadoes – the number of strong tornadoes have declined over the last half century
- Droughts and Floods – no statistically significant trends
- Wildfires – decreasing since 1800s. The increase in damage in recent years is due to population growth in vulnerable areas and poor forest management
- Snowfall – increasing in the fall and winter in the Northern Hemisphere and North America with many records being set.
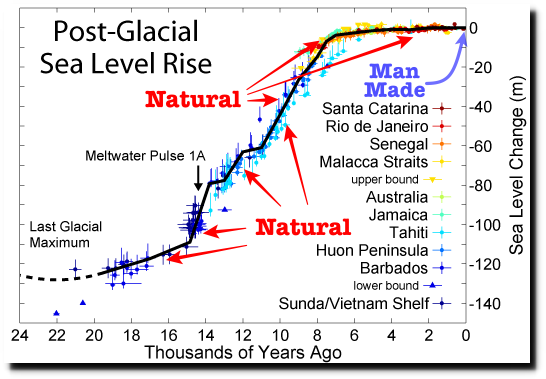
- Sea level – the rate of global sea level rise on average has fallen by 40% the last century. Where it is increasing – local factors such as land subsidence are to blame.
- Arctic, Antarctic and Greenland Ice – the polar ice varies with multidecadal cycles in ocean temperatures. Current levels are comparable to or above historical low levels
- Alaska July 2019 heat records – this resulted from a warm North Pacific and reduced ice in the Bering Sea late winter due to strong storms. The opposite occurred with record cold in 2012.
- Ocean Acidification – when life is considered, ocean acidification is often found to be a non-problem, or even a benefit.
- Carbon Pollution as a health hazard – carbon dioxide (CO2) is an odorless invisible trace gas that is plant food and it is essential to life on the planet. It is not a pollutant.
- Climate change is endangering food supply – the vitality of global vegetation in both managed and unmanaged ecosystems is better off now than it was a hundred years ago, 50 years ago, or even a mere two-to-three decades ago thanks in part to CO2.
LINK for the rest