25 year satellite map of old ice disappearing from Arctic. Pubs drone on about new ice that is irrel


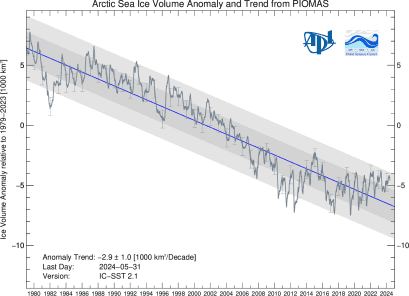
Fig.1 Arctic sea ice volume anomaly from PIOMAS updated once a month. Daily Sea Ice volume anomalies for each day are computed relative to the 1979 to 2011 average for that day of the year. Tickmarks on time axis refer to 1st day of year. The trend for the period 1979- present is shown in blue. Shaded areas show one and two standard deviations from the trend. Error bars indicate the uncertainty of the monthly anomaly plotted once per year.

Polar Science Center PIOMAS Arctic Sea Ice Volume Reanalysis

It would not take much of a drop for the arctic ocean to be essentialy ice free for a short time. We really don't know what effect that will have, but we are certainly going to find out.
there won't be any rise in sea level due to it.
 
Sure. lol
Tell us about all the great new ice in the Arctic. And I did give the experiment any 12 year old can do that proves CO2 retains heat.


According to your high priests the Arctic was supposed to be ice free by 2013. How exactly is that working out for you????


Arctic summers ice-free 'by 2013'


BBC NEWS Science Nature Arctic summers ice-free by 2013
Too gd close for comfort, Pub dupe. see OP.


Really? The global ice level is higher now, than it was 30 years ago. Arctic ice is within the two standard deviation for the last 40 years.

Barely within two standard deviations.

Arctic Sea Ice News and Analysis Sea ice data updated daily with one-day lag


Yet still within. That's the point. Other than when the wind piled it up in corners it has always been within the standard deviation. Now, the volume is increasing so the next year the coverage will be even greater. And the year after that. Face it olfraud, the predictions have been utterly wrong.
 
Lot of difference between "will be" and "could be", hater dupe. And BS, unless you can't tell the difference between old ice that takes decades to melt and new ice that can melt in weeks. Pro-pollution dupes...


Your whole scientific meme is based on "could's", "might's" and "may's". Show us a prediction that you AGW clowns have made that did not have one of those words in it. Go ahead little hater dupe. Present us ONE.
Since you are supposed to be a Phd Geologist, you know damned well that in scientific papers, one seldom states anything without qualifying it. You are playing to the audience of imbeciles here, Walleyes, not to those with any kind of scientific education. That is why most here with such an education hold you in such low esteem.

Now, tell me, when are you going to get around to presenting your proof that AGW is not real in a venue where it counts? Like maybe at one of the AGW conferances. Or one of the GSA conferances. The answer is never, because you and the rest of the deniars totally lack any kind of evidence. You are paid shills, whoring your scientific credentials to the energy corperations. And as such, are held in contempt by the vast majority of working scientists. And that is why you are constantly calling over 95% of all scientists frauds. Because that is what you are.


Bullshit. You show me where J. Tuzo Wilson said that the transverse faults "might" look like this. He described them to a T and said they WILL look like this. That's the difference between a soft science like climatology and a hard one. We TELL you what WILL happen. Climatologists are the ice skaters of the scientific world and they tell you what might happen. Or could happen. The problem is the exact opposite can always happen too, and, as we have seen with your high priests, the opposite seems to occur far more often then what they say.


Fig.1 Arctic sea ice volume anomaly from PIOMAS updated once a month. Daily Sea Ice volume anomalies for each day are computed relative to the 1979 to 2011 average for that day of the year. Tickmarks on time axis refer to 1st day of year. The trend for the period 1979- present is shown in blue. Shaded areas show one and two standard deviations from the trend. Error bars indicate the uncertainty of the monthly anomaly plotted once per year.

Polar Science Center PIOMAS Arctic Sea Ice Volume Reanalysis

It would not take much of a drop for the arctic ocean to be essentialy ice free for a short time. We really don't know what effect that will have, but we are certainly going to find out.



Why do they start in 1979? Why don't they start it in 1970 when those records start? Could it possibly be because the ice extent was so low in the early 1970's? Could that possibly be the reason for that?
 
The IPCC itself showed Arctic sea ice extent was comparable to now back in the middle 70's. Full time satellite coverage started in 1979 but that does not mean that history started 35 years ago. 5 years ago Piomas changed its 'computer model' and suddenly ice volume dropped dramatically. I think ASI has dropped but I also think the framing of the measurements and the timing have been used to exaggerate the situation.
 

Forum List

Back
Top