Old Rocks
Diamond Member
CO2 does not drive climate.
Says who, ignoramous?
Follow along with the video below to see how to install our site as a web app on your home screen.

Note: This feature currently requires accessing the site using the built-in Safari browser.
CO2 does not drive climate.
CO2 does not drive climate.
Says who, ignoramous?
Hey, Roxy, Abe said what happens in the US doesn't count.Of course, with that stated cooling trend, the glaciers in the US are growing. Right? Come on now, if it is cooling the glaciers have to be growing.
Retreat of Glaciers in Glacier National Park | Northern Rocky Mountain Science Center (NOROCK)
Glacier Retreat in the Pacific Northwest North Cascades National Park
You two need to get your talking points straight.
CO2 does not drive climate.
Says who, ignoramous?
Those that believe in science, unless you can post the datasets with source code to prove otherwise.
Hey, Roxy, Abe said what happens in the US doesn't count.Of course, with that stated cooling trend, the glaciers in the US are growing. Right? Come on now, if it is cooling the glaciers have to be growing.
Retreat of Glaciers in Glacier National Park | Northern Rocky Mountain Science Center (NOROCK)
Glacier Retreat in the Pacific Northwest North Cascades National Park
You two need to get your talking points straight.
Hey dumb fuck, what is happening to our glaciers is happening to virtually all the glaciers in the world as you well know. I have repeatedly posted the USGS site where the glaciers of the world are shown, and not a one of you silly assholes dare even look at it. You don't want to have your little alternative reality disturbed by what is happening.
USGS Professional Paper 1386

Says who, ignoramous?
Those that believe in science, unless you can post the datasets with source code to prove otherwise.
Hey dofus, I have doing so regularly. See the USGS site above. See the postition statements of the AGU and GSA. All you have is unsupported flap yap.
Unlike in the Arctic, a strong decline in sea ice extent has not been observed in the Antarctic during the period of satellite observations (Section 4.4.2.2). Fichefet et al. (2003) conducted a simulation of Antarctic ice thickness using observationally based atmospheric forcing covering the period 1958 to 1999. They note pronounced decadal variability, with area average ice thickness varying by ±0.1 m (compared to a mean thickness of roughly 0.9 m), but no long-term trend. However, Gregory et al. (2002b) find a decline in antarctic sea ice extent in their model, contrary to observations. They suggest that the lack of consistency between the observed and modelled changes in sea ice extent might reflect an unrealistic simulation of regional warming around Antarctica, rather than a deficiency in the ice model. Holland and Raphael (2006) examine sea ice variability in six MMD 20C3M simulations that include stratospheric ozone depletion. They conclude that the observed weak increase in antarctic sea ice extent is not inconsistent with simulated internal variability, with some simulations reproducing the observed trend over 1979 to 2000, although the models exhibit larger interannual variability in sea ice extent than satellite observations.
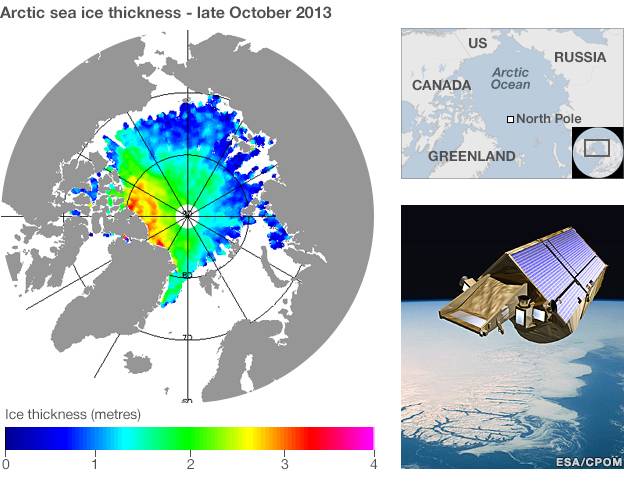
The bounce back in the extent of sea ice in the Arctic this summer was reflected also in the volume of ice.
Data from Europe's Cryosat spacecraft suggests there were almost 9,000 cu km of ice at the end of this year's melt season.
This is close to 50% more than in the corresponding period in 2012.
The UN's climate science body has admitted that a claim made in its 2007 report - that Himalayan glaciers could melt away by 2035 - was unfounded.
The admission today followed a New Scientist article last week that revealed the source of the claim made in the 2007 report by the Intergovernmental Panel on Climate Change (IPCC) was not peer-reviewed scientific literature but a media interview with a scientist conducted in 1999. Several senior scientists have now said the claim was unrealistic and that the large Himalayan glaciers could not melt in a few decades.
In a statement (pdf), the IPCC said the paragraph "refers to poorly substantiated estimates of rate of recession and date for the disappearance of Himalayan glaciers. In drafting the paragraph in question, the clear and well-established standards of evidence, required by the IPCC procedures, were not applied properly."
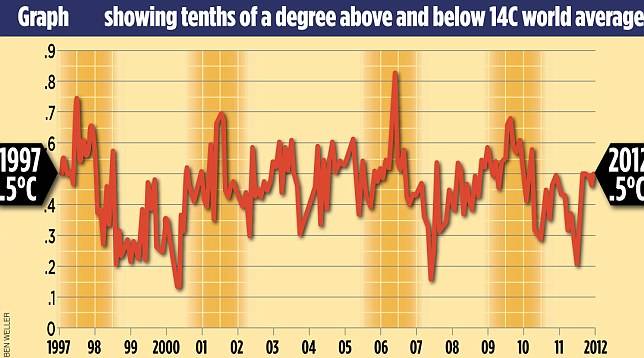
-The figures reveal that from the beginning of 1997 until August 2012 there was no discernible rise in aggregate global temperatures
-This means that the pause in global warming has now lasted for about the same time as the previous period when temperatures rose, 1980 to 1996
The world stopped getting warmer almost 16 years ago, according to new data released last week (NOTE: last week is the week preceding October 13, 2012)
The figures, which have triggered debate among climate scientists, reveal that from the beginning of 1997 until August 2012, there was no discernible rise in aggregate global temperatures.
This means that the plateau or pause in global warming has now lasted for about the same time as the previous period when temperatures rose, 1980 to 1996. Before that, temperatures had been stable or declining for about 40 years.
Unlike in the Arctic, a strong decline in sea ice extent has not been observed in the Antarctic during the period of satellite observations (Section 4.4.2.2). Fichefet et al. (2003) conducted a simulation of Antarctic ice thickness using observationally based atmospheric forcing covering the period 1958 to 1999. They note pronounced decadal variability, with area average ice thickness varying by ±0.1 m (compared to a mean thickness of roughly 0.9 m), but no long-term trend. However, Gregory et al. (2002b) find a decline in antarctic sea ice extent in their model, contrary to observations. They suggest that the lack of consistency between the observed and modelled changes in sea ice extent might reflect an unrealistic simulation of regional warming around Antarctica, rather than a deficiency in the ice model. Holland and Raphael (2006) examine sea ice variability in six MMD 20C3M simulations that include stratospheric ozone depletion. They conclude that the observed weak increase in antarctic sea ice extent is not inconsistent with simulated internal variability, with some simulations reproducing the observed trend over 1979 to 2000, although the models exhibit larger interannual variability in sea ice extent than satellite observations.
9.5.5 Cryosphere Changes - AR4 WGI Chapter 9: Understanding and Attributing Climate Change
Let's begin with the dismantling of the global warming theory, one step at a time.
First, beginning with Al Gore's prediction that by 2013 the ice caps would be fully melted:
However in October, there was a record amount of ice in the South Pole (See image below)
The bounce back in the extent of sea ice in the Arctic this summer was reflected also in the volume of ice.
Data from Europe's Cryosat spacecraft suggests there were almost 9,000 cu km of ice at the end of this year's melt season.
This is close to 50% more than in the corresponding period in 2012.
BBC News - Esa's Cryosat sees Arctic sea-ice volume bounce back
That's strike one.
Then we get to the IPCC's misstep on the Himalayan glaciers, which they predicted would melt away by 2035:
IPCC officials admit mistake over melting Himalayan glaciers | Environment | theguardian.com
The UN's climate science body has admitted that a claim made in its 2007 report - that Himalayan glaciers could melt away by 2035 - was unfounded.
The admission today followed a New Scientist article last week that revealed the source of the claim made in the 2007 report by the Intergovernmental Panel on Climate Change (IPCC) was not peer-reviewed scientific literature but a media interview with a scientist conducted in 1999. Several senior scientists have now said the claim was unrealistic and that the large Himalayan glaciers could not melt in a few decades.
In a statement (pdf), the IPCC said the paragraph "refers to poorly substantiated estimates of rate of recession and date for the disappearance of Himalayan glaciers. In drafting the paragraph in question, the clear and well-established standards of evidence, required by the IPCC procedures, were not applied properly."
That's strike two.
Then there's entire idea of man-made global warming, which people have insisted since the time of Svante Arrhenius in the 19th Century (the progenitor of the Anthropogenic Global Warming theory) would eventually destroy the the planet or irreparably harm the atmosphere. However, nearly a century after Arrhenius posited this theory, it has been discovered that global warming stopped in 1997:
In October 2012, the UK's Met Office released concessionary data that suggested that global warming ceased as much as 15 years before, in 1997:
-The figures reveal that from the beginning of 1997 until August 2012 there was no discernible rise in aggregate global temperatures
-This means that the pause in global warming has now lasted for about the same time as the previous period when temperatures rose, 1980 to 1996
The world stopped getting warmer almost 16 years ago, according to new data released last week (NOTE: last week is the week preceding October 13, 2012)
The figures, which have triggered debate among climate scientists, reveal that from the beginning of 1997 until August 2012, there was no discernible rise in aggregate global temperatures.
This means that the plateau or pause in global warming has now lasted for about the same time as the previous period when temperatures rose, 1980 to 1996. Before that, temperatures had been stable or declining for about 40 years.
That's strike three.
Unlike in the Arctic, a strong decline in sea ice extent has not been observed in the Antarctic during the period of satellite observations (Section 4.4.2.2). Fichefet et al. (2003) conducted a simulation of Antarctic ice thickness using observationally based atmospheric forcing covering the period 1958 to 1999. They note pronounced decadal variability, with area average ice thickness varying by ±0.1 m (compared to a mean thickness of roughly 0.9 m), but no long-term trend. However, Gregory et al. (2002b) find a decline in antarctic sea ice extent in their model, contrary to observations. They suggest that the lack of consistency between the observed and modelled changes in sea ice extent might reflect an unrealistic simulation of regional warming around Antarctica, rather than a deficiency in the ice model. Holland and Raphael (2006) examine sea ice variability in six MMD 20C3M simulations that include stratospheric ozone depletion. They conclude that the observed weak increase in antarctic sea ice extent is not inconsistent with simulated internal variability, with some simulations reproducing the observed trend over 1979 to 2000, although the models exhibit larger interannual variability in sea ice extent than satellite observations.
9.5.5 Cryosphere Changes - AR4 WGI Chapter 9: Understanding and Attributing Climate Change
And? Antarctic sea ice has had a slight increase. Arctic sea ice has had a major decrease. The continent of Antarctica is losing gigatons of ice annually, and the loss is increasing. Same for the Greenland ice cap.
http://arctic.atmos.uiuc.edu/cryosphere/IMAGES/seaice.anomaly.arctic.png
http://arctic.atmos.uiuc.edu/cryosphere/IMAGES/seaice.anomaly.antarctic.png
http://www.skepticalscience.com/images/Antarctica_Ice_Mass.gif
http://www.skepticalscience.com/images/Greenland_Ice_Mass.gif
Hey, Roxy, Abe said what happens in the US doesn't count.
You two need to get your talking points straight.
Hey dumb fuck, what is happening to our glaciers is happening to virtually all the glaciers in the world as you well know. I have repeatedly posted the USGS site where the glaciers of the world are shown, and not a one of you silly assholes dare even look at it. You don't want to have your little alternative reality disturbed by what is happening.
USGS Professional Paper 1386
So basically you have no datasets with source code to prove that CO2 drives climate.
Thought so, but you can carry on with your AGW religion, but just know that it is a religion not based on science.
And? Antarctic sea ice has had a slight increase. Arctic sea ice has had a major decrease. The continent of Antarctica is losing gigatons of ice annually, and the loss is increasing. Same for the Greenland ice cap.
http://arctic.atmos.uiuc.edu/cryosphere/IMAGES/seaice.anomaly.arctic.png
http://arctic.atmos.uiuc.edu/cryosphere/IMAGES/seaice.anomaly.antarctic.png
http://www.skepticalscience.com/images/Antarctica_Ice_Mass.gif
http://www.skepticalscience.com/images/Greenland_Ice_Mass.gif
And yet not one link to the datasets with source code that proves CO2 drives climate. I have been asking this of the AGW cultists (for over 20 years) to produce this in order to prove their "science", even asked James Hansen to do this and still so far nothing.
The AGW bible says that as CO2 rises so does temperature. So far that has not been the case. CO2 does not drive climate and it never has.
You can post all the AGW propaganda you wish, but that is all it will ever be.
Even ice core samples have proven that CO2 has never driven climate.
Give us some bona fides concerning your Phd in climatology, physics, or something to indicate your level of expertise in this field. Otherwise, expect to see your flap-yap labeled as such without links to papers by real scientists. Flat out bald unsupported statements without any support are simply an indication of your level of intellectual laziness.
Hey dumb fuck, what is happening to our glaciers is happening to virtually all the glaciers in the world as you well know. I have repeatedly posted the USGS site where the glaciers of the world are shown, and not a one of you silly assholes dare even look at it. You don't want to have your little alternative reality disturbed by what is happening.
USGS Professional Paper 1386
So basically you have no datasets with source code to prove that CO2 drives climate.
Thought so, but you can carry on with your AGW religion, but just know that it is a religion not based on science.
How do we know more CO2 is causing warming?
.Must Go Up
How long has CO2 been contributing to increased warming? According to NASA, Two-thirds of the warming has occurred since 1975. Is there a reliable way to identify CO2s influence on temperatures over that period?
There is: we can measure the wavelengths of long-wave radiation leaving the Earth (upward radiation). Satellites have recorded the Earth's outbound radiation. We can examine the spectrum of upward long-wave radiation in 1970 and 1997 to see if there are changes.
http://jvarekamp.web.wesleyan.edu/CO2/FP-1.pdf
Abstract
This experiment explored the absorptivity of four peaks, 1437, 1955, 2013, and
2060 nanometers, in the near-IR (NIR) absorption spectrum of CO2. The NIR absorption
bands in CO2 can contribute up to 30% of the total solar heating in the mesosphere.
Between the heights of 60-85 km the heating can exceed 1 K/day. (Fomichev & Shved,
1988; Ogibalov & Fomichev, 2003; Fomichev et al., 2004) With CO2 concentrations
increasing (West, 2005) it is ever more important to understand the absorbance properties
of this molecule in all of its absorbance bands. Modeling of the Beer Lambert law found
the absorption coefficient at 1955 nanometers to be 0.25 m2 mol-1 and the absorption
coefficient for the peaks at 2013 and 2060 nanometers to be 0.43 m2 mol-1. The
absorption peak at 1437 nanometers had an absorption coefficient >>10.
for N2 . In other words , there is transfer between vibrational and translational degrees of freedom in the process (2) . This process in non equilibrium conditions is sometimes called thermalization . happens at the same time as the emission process (← . Because the number of excited molecules in a small volume in LTE must stay constant , follows that both processes emission/absorption must balance . In other words CO2 which absorbs strongly the 15µ IR , will emit strongly almost exactly as much 15 µ radiation as it absorbs . This is independent of the CO2 concentrations and of the intensity of IR radiation .Give us some bona fides concerning your Phd in climatology, physics, or something to indicate your level of expertise in this field. Otherwise, expect to see your flap-yap labeled as such without links to papers by real scientists. Flat out bald unsupported statements without any support are simply an indication of your level of intellectual laziness.
Bona fides = Colder and colder as fuck outside during "Global Warming".
Doesn't take a degree.
Give us some bona fides concerning your Phd in climatology, physics, or something to indicate your level of expertise in this field. Otherwise, expect to see your flap-yap labeled as such without links to papers by real scientists. Flat out bald unsupported statements without any support are simply an indication of your level of intellectual laziness.
Bona fides = Colder and colder as fuck outside during "Global Warming".
Doesn't take a degree.
Where you are at. Talk to a bunch of people in Siberia right now.
If you wish to be purposely blind to what is happening on a global basis, that is your perogative. Don't expect those of us that are concerned with science to share your alternative reality.
