2011 9th Warmest Year in Satellite Record

ScienceRocks

Democrat all the way!
Mar 16, 2010
59,455
6,793
1,900
The Good insane United states of America
2011 9th Warmest Year in Satellite Record
January 4th, 2012 at 10:16 pm by Jim Spencer under Weather
2011 9th Warmest Year in Satellite Record | KXAN.com Blogs
Global Temperature Report: December 2011

Global climate trend since Nov. 16, 1978: +0.13 C per decade

December temperatures (preliminary)

Global composite temp.: +0.13 C (about 0.23 degrees Fahrenheit) above 30-year average for December.

Northern Hemisphere: +0.20 C (about 0.36 degrees Fahrenheit) above 30-year average for December.

Southern Hemisphere: +0.06 C (about 0.11 degrees Fahrenheit) above 30-year average for December.

Tropics: +0.04 C (about 0.07 degrees Fahrenheit) above 30-year average for December.

(All temperature anomalies are based on a 30-year average (1981-2010) for the month reported.)

Notes on data released Jan. 4, 2012:

2011 was the ninth warmest year (globally averaged) in the 33-year global satellite record despite La Niña Pacific Ocean cooling events at the start and finish of the year, according to John Christy, a professor of atmospheric science and director of the Earth System Science Center (ESSC) at The University of Alabama in Huntsville. Globally averaged, Earth’s atmosphere was 0.15 C (0.27 degree Fahrenheit) warmer than the 30-year average in 2011; That was less than half of the warming anomaly seen in 2010.

Average annual global
temperature anomalies,
warmest to coolest
1979 – 2011

1998 0.424
2010 0.411
2005 0.251
2002 0.22
2009 0.187
2003 0.185
2006 0.175
2007 0.168
2011 0.15
2001 0.112
2004 0.104
1991 0.025
1987 0.018
1995 0.018
1988 0.017
1980 -0.003
1990 -0.017
1981 -0.04
2008 -0.041
1997 -0.044
1999 -0.051
1983 -0.056
2000 -0.056
1996 -0.071
1994 -0.104
1979 -0.165
1989 -0.202
1986 -0.239
1993 -0.24
1982 -0.245
1992 -0.284
1985 -0.304
1984 -0.348

With A COLDER SET UP for 2011 we got 9th, while 2008 had the 19th coldest at 2008 -0.041c. 2011 had a double nina...That hasn't happened since 1999-2001 nina cycle. The first nina in 2008 may of been close to the first one, but we didn't go below -.5c globally or even a offical second nina. This year we made -1.0 or moderate for the second nina and never warmed up at all.

This year was a impressive .191c warmer then 2008!

Ladies and gents, if this year couldn't knock us outside of the 10th warmest years-- we aren't ever going to see another in are life times. Seriously, no nina event since 1974 was as strong. Yes, sir we just faced down one of the coldest patterns in 40 years in laughed in its face! A pattern that could of put us near 1984-1985 or lower on that list.
 
Last edited:
Yeah, the La Nina conditions have kept the averages a tiny bit lower this last year so that means that the next El Nino on top of the cumulative greenhouse warming will soon give us some new record high temperature years. It is also worth remembering that our Jan-Dec year is arbitrary so the yearly rankings, like in your list, are somewhat arbitrary too. Looking at every consecutive twelve month period on record and comparing it every other 12 month period on record, the very recent period from June 2009 to May 2010 was, in fact, the warmest 'year' on record since widespread record keeping began in the late 1800's. The first half of 2010 was so hot that only the beginning of a new La Nina period in mid 2010 kept the year from being the hottest year on record by a large margin rather than just ending up being tied with 2005 as the formal 'hottest year on record'.

Here's some more detailed info about that period from Dr. Jeff Masters, a professional meteorologist and climate scientist.

Globe has 3rd consecutive warmest month on record
Dr. Jeff Masters
June 17, 2010
(excerpts)
The globe recorded its warmest May since record keeping began in 1880, according to the National Oceanic and Atmospheric Administration's (NOAA's) National Climatic Data Center (NCDC). The May temperature anomaly of 0.69°C (1.24°F) beat the previous record set in 1998 by 0.06°C. We've now had three consecutive warmest months on record, the first time that has happened since 1998. NASA's Goddard Institute for Space Studies also rated May 2010 as the warmest May on record, tied with May 1998. Both NOAA and NASA rated the year-to-date period, January - May, as the warmest such period on record, and the last 12-month period (June 2009 - May 2010) as the warmest 12-month period on record. May 2010 global ocean temperatures were the second warmest on record, while land temperatures were the warmest on record. Global satellite-measured temperatures for the lowest 8 km of the atmosphere were the 2nd warmest on record in May, according to both the University of Alabama Huntsville (UAH) and Remote Sensing Systems (RSS) groups.

Asia and Southeast Asia record their hottest temperatures in history
The mercury hit an astonishing 53.5°C (128.3°F) at MohenjuDaro, Pakistan, on May 26. Not only is the 128.3°F reading the hottest temperature ever recorded in Pakistan, it is the hottest reliably measured temperature ever recorded on the continent of Asia. The evidence for this record is detailed in a post I made earlier this month. The Pakistan heat wave killed at least 18 Pakistanis, and temperatures in excess of 50°C (122°F) were recorded at nine Pakistani cities on May 26, including 53°C (127.4°F) at Sibi. Record heat also hit Southeast Asia in May. According to the Myanmar Department of Meteorology and Hydrology, Myanmar (Burma) had its hottest temperature in its recorded history on May 12, when the mercury hit 47°C (116.6°F) in Myinmu. Myanmar's previous hottest temperature was 45.8°C (114.4°F) at Minbu, Magwe division on May 9, 1998. According to Chris Burt, author of Extreme Weather, the 47°C (116.6°F) measured on May 12 this year is the hottest temperature measured in Southeast Asia in recorded history.
 
what is more important, the actual average temp of any particular year or the change from the proceeding year? the 90's saw a lot of increase but the 00's were stagnant at a high average. which measurement carries more information, the actual temperature or the rate of change?

is CO2 more important than cloud cover? or is it Matthew's beloved ENSO? I don't think we have peeled away enough onion skin to know yet but I think we should keep measuring everything we can. the answer is down the road and we will find it. even after this disasterous detour into the CO2 cul-de-sac we have taken.
 
2011 9th Warmest Year in Satellite Record
January 4th, 2012 at 10:16 pm by Jim Spencer under Weather
2011 9th Warmest Year in Satellite Record | KXAN.com Blogs
Global Temperature Report: December 2011

That's another way of saying "temperatures have been flat."
Even assuming that 9 of the top 10 temps being from the last decade means that temps have been "flat" for a decade, shouldn't they be cooling? Isn't a warm cycle supposed to be followed by a cool cycle? There hasn't been a cooling cycle for 100 years! Each warm cycle has been followed by a flat cycle that was followed by a new warm cycle that begins about the same place the old warm cycle left off. What has happened to the natural cooling cycles????
 
when should the recovery from the Little Ice Age end? I dont think anyone knows. but I dont think we will be happy when the temps go back down again. cold is not good for civilization
 
Still, the stubborn fact remains, that although satellites can observe the temperature, they STILL can't tell us the CAUSE of any temperature increase.

1- So, WITH UNCOMPROMISED PROOF (no EAU Climate, NASA or Penn State data and unverified compromised surface stations), what is causing the temperature warmer this year, versus any other?

2- Can you explain how there is no possible way nature caused it without man's help?

3- Is there ANY solution that does not require threat of government force to create?

4- Can you guarantee a quantifiable, measurable result from your solution showing it's direct effect on temperatures inside a reasonable timeframe?


Just as a reminder, over 75% of this planet is covered in water and is not habitable by man. Out of the remaining <25%, less than 10% of that is urbanized. Mankind may produce billions of tons of CO2 a year, but that is still less than 0.0005% of atmospheric composition, while water vapor accounts for about 4%, and cannot be quantified or measured on it's impact, AND is a far more powerful green house gas.

The Chicken Little Chorus hasn't been able to answer these 4 questions in over 5 years of asking. Do you think you can do it?
 
That's another way of saying "temperatures have been flat."
Even assuming that 9 of the top 10 temps being from the last decade means that temps have been "flat" for a decade, shouldn't they be cooling? Isn't a warm cycle supposed to be followed by a cool cycle? There hasn't been a cooling cycle for 100 years! Each warm cycle has been followed by a flat cycle that was followed by a new warm cycle that begins about the same place the old warm cycle left off. What has happened to the natural cooling cycles????

100 years is a very short time when you look at the history of the climate. We had a warm period during the roman empire and another one that peaked around 1200 AD. That's a separation of roughly 1000 years. Our climate has been warming since about the year 1650. 100 years is nothing

Those cooling periods were not good times for the human race. They were times of famine, drought and blight.
 
what is more important, the actual average temp of any particular year or the change from the proceeding year? the 90's saw a lot of increase but the 00's were stagnant at a high average. which measurement carries more information, the actual temperature or the rate of change?
Ah yes, the moldy old denier cult myths - "warming stopped in 1998' & 'temperatures flat for last decade'.

Global warming greatest in past decade
PhysOrg.com
September 1, 2008
(excerpts)

Researchers confirm that surface temperatures in the Northern Hemisphere were warmer over the last 10 years than any time during the last 1300 years, and, if the climate scientists include the somewhat controversial data derived from tree-ring records, the warming is anomalous for at least 1700 years.

"Some have argued that tree-ring data is unacceptable for this type of study," says Michael Mann, associate professor of meteorology and geosciences and director of Penn State's Earth System Science Center. "Now we can eliminate tree rings and still have enough data from other so-called 'proxies' to derive a long-term Northern Hemisphere temperature record." The proxies used by the researchers included information from marine and lake sediment cores, ice cores, coral cores and tree rings. "We looked at a much expanded database and our methods are more sophisticated than those used previously," says Mann.


What has global warming done since 1998?
Last updated on 18 December 2011
(excerpts)

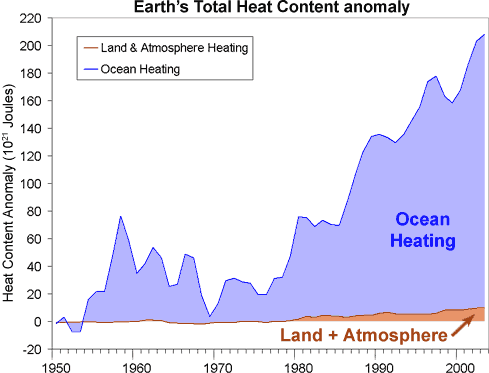
To claim global warming stopped in 1998 overlooks one simple physical reality - the land and atmosphere are just a small fraction of the Earth's climate (albeit the part we inhabit). The entire planet is accumulating heat due to an energy imbalance. The atmosphere is warming. Oceans are accumulating energy. Land absorbs energy and ice absorbs heat to melt. To get the full picture on global warming, you need to view the Earth's entire heat content.

This analysis is performed in An observationally based energy balance for the Earth since 1950 (Murphy 2009) which adds up heat content from the ocean, atmosphere, land and ice. To calculate the Earth's total heat content, the authors used data of ocean heat content from the upper 700 metres. They included heat content from deeper waters down to 3000 metres depth. They computed atmospheric heat content using the surface temperature record and the heat capacity of the troposphere. Land and ice heat content (the energy required to melt ice) were also included.

Total-Heat-Content.gif

Figure 1: Total Earth Heat Content anomaly from 1950 (Murphy 2009). Ocean data taken from Domingues et al 2008. Land + Atmosphere includes the heat absorbed to melt ice.

A look at the Earth's total heat content clearly shows global warming has continued past 1998. The planet is still accumulating heat. So why do surface temperature records show 1998 as the hottest year on record? We see in Figure 1 that the heat capacity of the land and atmosphere is small compared to the ocean. Hence, relatively small exchanges of heat between the atmosphere and ocean can cause significant changes in surface temperature.

In 1998, an abnormally strong El Nino caused heat transfer from the Pacific Ocean to the atmosphere. Consequently, we experienced above average surface temperatures. Conversely, the last few years have seen moderate La Nina conditions which had a cooling effect on global temperatures. And the last few months have swung back to warmer El Nino conditions. This has coincided with the warmest June-August sea surface temperatures on record. This internal variation where heat is shuffled around our climate is the reason why surface temperature is such a noisy signal.


is CO2 more important than cloud cover? or is it Matthew's beloved ENSO?
CO2 is definitely more important than either one of those in the long term. CO2 levels can keep increasing indefinitely and the greenhouse effects will get greater. Cloud cover can both reflect sunlight away from the Earth and trap heat energy underneath them (clear winter nights are much colder than cloud covered winter nights) and the ENSO variations just move the heat around between the atmosphere and the oceans. Rising CO2 levels will inevitably trap even more heat energy in the Earth's atmosphere and oceans.


I don't think we have peeled away enough onion skin to know yet but I think we should keep measuring everything we can. the answer is down the road and we will find it. even after this disasterous(sic) detour into the CO2 cul-de-sac we have taken.
I'm more interested in what the professional climate scientists "think" than what some confused and deluded random bystander like yourself "thinks". That you are in fact a deluded tool of the fossil fuel industry is clearly revealed by your use of the idiotic and meaningless denier cult phrase: "CO2 cul-de-sac". The fact that you deny the scientifically established physics of greenhouse gases shows you to be just another anti-science righwingnut clueless denier dupe.
 
Still, the stubborn fact remains, that although satellites can observe the temperature, they STILL can't tell us the CAUSE of any temperature increase.

1- So, WITH UNCOMPROMISED PROOF (no EAU Climate, NASA or Penn State data and unverified compromised surface stations), what is causing the temperature warmer this year, versus any other?

2- Can you explain how there is no possible way nature caused it without man's help?

3- Is there ANY solution that does not require threat of government force to create?

4- Can you guarantee a quantifiable, measurable result from your solution showing it's direct effect on temperatures inside a reasonable timeframe?


Just as a reminder, over 75% of this planet is covered in water and is not habitable by man. Out of the remaining <25%, less than 10% of that is urbanized. Mankind may produce billions of tons of CO2 a year, but that is still less than 0.0005% of atmospheric composition, while water vapor accounts for about 4%, and cannot be quantified or measured on it's impact, AND is a far more powerful green house gas.

The Chicken Little Chorus hasn't been able to answer these 4 questions in over 5 years of asking. Do you think you can do it?
Man... tha's a lotta crickets out there.

Well, bigfritz, it's like this - when you ask questions as stupidly ignorant as those, you can expect to be ignored. Try learning something about the subject before coming here to debate. Of course, to actually learn something, you would obviously have to first un-learn the lies and misinformation you've been fed by the propagandists for the fossil fuel industry. That is probably beyond your rather meager mental capacities, given the level of brainwashing to which you've been subjected.

However, if you are truly looking for honest answers and not just following the rightwingnut political agenda of anti-science reality denial, try reading this.

The Discovery of Global Warming


***
 
Trolling Blunder, if you're trying to respond to me, don't bother. I ignore non-sentient collections of protoplasm and gristle.
 
2011 9th Warmest Year in Satellite Record
January 4th, 2012 at 10:16 pm by Jim Spencer under Weather
2011 9th Warmest Year in Satellite Record | KXAN.com Blogs
Global Temperature Report: December 2011

That's another way of saying "temperatures have been flat."

Ah yes. Flat. 2010 ties 1998. Yet 1998 was a super El Nino, 2010, a moderate one with the last half of the year in La Nina conditions.

UAH Global Temperature Update for Dec. 2011: +0.13 deg. C « Roy Spencer, Ph. D.

Look at that 13 month average on the graph. Since 1998 we have had two short periods where the low points actually went below some of the high points before 1998. For most of the time, that line has been well above the highest points on the graph prior to 1998.

When we get another El Nino, 1998 is going to look the same compared to that as 1995 looks when compared to 1998. Then, when the ENSO changes again, you dingbats will once again be claiming, "See, it's cooling.
 
You're still on ignore too, Millrat. I've heard all your lather, rinse, repeat arguments and charts and don't need to bore myself anymore.

Again, sentient beings may reply. You must be at least that smart to ride this ride.
 
Last edited:
what is more important, the actual average temp of any particular year or the change from the proceeding year? the 90's saw a lot of increase but the 00's were stagnant at a high average. which measurement carries more information, the actual temperature or the rate of change?
Ah yes, the moldy old denier cult myths - "warming stopped in 1998' & 'temperatures flat for last decade'.

Global warming greatest in past decade
PhysOrg.com
September 1, 2008
(excerpts)

Researchers confirm that surface temperatures in the Northern Hemisphere were warmer over the last 10 years than any time during the last 1300 years, and, if the climate scientists include the somewhat controversial data derived from tree-ring records, the warming is anomalous for at least 1700 years.

"Some have argued that tree-ring data is unacceptable for this type of study," says Michael Mann, associate professor of meteorology and geosciences and director of Penn State's Earth System Science Center. "Now we can eliminate tree rings and still have enough data from other so-called 'proxies' to derive a long-term Northern Hemisphere temperature record." The proxies used by the researchers included information from marine and lake sediment cores, ice cores, coral cores and tree rings. "We looked at a much expanded database and our methods are more sophisticated than those used previously," says Mann.


What has global warming done since 1998?
Last updated on 18 December 2011
(excerpts)

To claim global warming stopped in 1998 overlooks one simple physical reality - the land and atmosphere are just a small fraction of the Earth's climate (albeit the part we inhabit). The entire planet is accumulating heat due to an energy imbalance. The atmosphere is warming. Oceans are accumulating energy. Land absorbs energy and ice absorbs heat to melt. To get the full picture on global warming, you need to view the Earth's entire heat content.

This analysis is performed in An observationally based energy balance for the Earth since 1950 (Murphy 2009) which adds up heat content from the ocean, atmosphere, land and ice. To calculate the Earth's total heat content, the authors used data of ocean heat content from the upper 700 metres. They included heat content from deeper waters down to 3000 metres depth. They computed atmospheric heat content using the surface temperature record and the heat capacity of the troposphere. Land and ice heat content (the energy required to melt ice) were also included.

Total-Heat-Content.gif

Figure 1: Total Earth Heat Content anomaly from 1950 (Murphy 2009). Ocean data taken from Domingues et al 2008. Land + Atmosphere includes the heat absorbed to melt ice.

A look at the Earth's total heat content clearly shows global warming has continued past 1998. The planet is still accumulating heat. So why do surface temperature records show 1998 as the hottest year on record? We see in Figure 1 that the heat capacity of the land and atmosphere is small compared to the ocean. Hence, relatively small exchanges of heat between the atmosphere and ocean can cause significant changes in surface temperature.

In 1998, an abnormally strong El Nino caused heat transfer from the Pacific Ocean to the atmosphere. Consequently, we experienced above average surface temperatures. Conversely, the last few years have seen moderate La Nina conditions which had a cooling effect on global temperatures. And the last few months have swung back to warmer El Nino conditions. This has coincided with the warmest June-August sea surface temperatures on record. This internal variation where heat is shuffled around our climate is the reason why surface temperature is such a noisy signal.


is CO2 more important than cloud cover? or is it Matthew's beloved ENSO?
CO2 is definitely more important than either one of those in the long term. CO2 levels can keep increasing indefinitely and the greenhouse effects will get greater. Cloud cover can both reflect sunlight away from the Earth and trap heat energy underneath them (clear winter nights are much colder than cloud covered winter nights) and the ENSO variations just move the heat around between the atmosphere and the oceans. Rising CO2 levels will inevitably trap even more heat energy in the Earth's atmosphere and oceans.


I don't think we have peeled away enough onion skin to know yet but I think we should keep measuring everything we can. the answer is down the road and we will find it. even after this disasterous(sic) detour into the CO2 cul-de-sac we have taken.
I'm more interested in what the professional climate scientists "think" than what some confused and deluded random bystander like yourself "thinks". That you are in fact a deluded tool of the fossil fuel industry is clearly revealed by your use of the idiotic and meaningless denier cult phrase: "CO2 cul-de-sac". The fact that you deny the scientifically established physics of greenhouse gases shows you to be just another anti-science righwingnut clueless denier dupe.

I am more interested in what the data say than in the exaggerated and distorted thoughts and conclusions of some of the 'professional climate scientists'. I am even less interested in your ad homs like "deluded tool of the fossil fuel industry" and "anti-science righwingnut clueless denier dupe". but if that is your style and it makes you happy, go right ahead.

you think I am being duped and deluded but you never consider that you are at risk of the same thing by credulously believing everything as presented to you, especially when you get it via SkepticalScience.

Total-Heat-Content.gif


ie- is this graph reasonable or is it emotionally affecting you to come to erroneous conclusions? you have to examine the labelling of the x and y axis and the positioning of the origin. if the intent was to show that the heat content of the atmosphere is miniscule compared to the oceans then it is alright. but if it is trying to show the relative increase of heat content of the oceans it is wildly deceiving. the average global temp is what? ~288K? and the increase has been less than 1K since 1950 so the actual increase in heat content is a very small fraction. are the measurements before ARGO widespread and reliable? not really but we have to start with something. here is a graph of NODC figures since 1955, before and after the adjustment in 2010.

2vhsta8.jpg


notice that the heat content now looks more like the the global temp curve, which is reasonable. another thing to notice is the type of corrections that were made when it was no longer possible to hide decreased rate of warming. unlike Hansen's GISS land temp adjustments that are unaccountable to scrutiny the OHC adjustments had to make sense. so the artificial lowering of older measurements and raising of newer measurements had to be reversed.

I dont mind that you speak up and defend CAGW. once you make up your mind it is hard to change but I have never been close to being convinced that it is the only or even the best description of the realities of the last few hundreds or thousands of years. I do find it disheartening that so many people like you are willing to mix the scientific and political components together and then resort to an us-vs-them mentality where you no longer even think about the direction the evidence is leading.
 
Interesting graph, Ian. Note the relitively flat area from 1976 to 1996. Then look at the very rapid rise from 1995 to 2001. So we have another flat period going on right now. Tell me, how long is it going to last, and how far up will the next rise ratchet the climate?

For that is what we are seeing in all the records. Ice, atmospheric temperatures, and ocean temperatures. Where once we saw rise and fall, now we see rise and plateu, then another rapid rise. Or, is the case of the ice, rapid decline.

And, in the case of the ice, a threat that nature will now become the driver of the climate change as the clathrates outgass. Then you can truly say that it is nature, not us. As a significant portion of the wolrds human population dies from the effects we triggered.
 

Forum List

Back
Top