Rikurzhen
Gold Member
- Jul 24, 2014
- 6,145
- 1,292
- 185
Anyone who takes the OP study seriously should seek mental help. The statistical analysis is absolutely horrible and completely unsound. For example, the study says the number of working age natives holding a job decreased by about 127,000 from 2000 to 2014. That decrease could be caused equally by the size of the native-born force decreasing, or many in the native-born labor force not working due to pursuing a college education.
You're my favorite type of commenter, the one whose mouth loves writing checks that your ass can't cash.
So let me understand your strategy. People who take the OP seriously need mental help but you rebut the OP by appealing to imaginary facts like the " the size of the native-born force decreasing, or many in the native-born labor force not working due to pursuing a college education."
Freaking priceless. You're delusional and your counseling people who read a statistical analysis and understand it that they are the ones who need mental help. Why don't you lay yourself down on the analyst's couch and we can commence with your electroshock therapy.
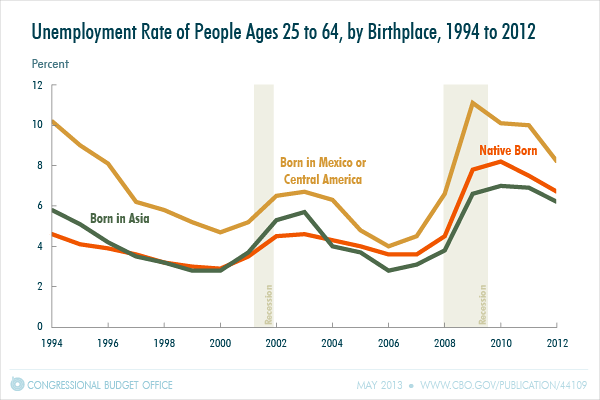
And that is EXACTLY what has happened over the past decade. The U.S. labor force has been shrinking, so of course the number of people in the labor force with jobs will be less--the labor force is smaller to begin with! If not for young immigrants, there would be even fewer people in the labor force, the median age in the U.S. would be higher, and we would be facing an aging crisis more similar to Japan.
The labor force has been shrinking? Who says? The native born working age population has increased over time. These people are the labor force. In 2000 there were 41 million native born citizens in the labor force population who were not working. By 2013 there were 58 million native born citizens in the labor force who were not working. How is an increase of 17 million native born citizens seen as a decrease?
Likewise, more native-born Americans are attending college than ever before, thus being a working age native-born but deciding not to be employed. They shouldn't be working--they are getting an education that will allow them to get better paying jobs that most immigrants are either under or overqualified for.
Oh, is that what's happening. Hang on, the nurse has to give you another electroshock. While she's doing that I'm going to go and fetch a graph to help you understand why the doctor has strapped you into restraints:
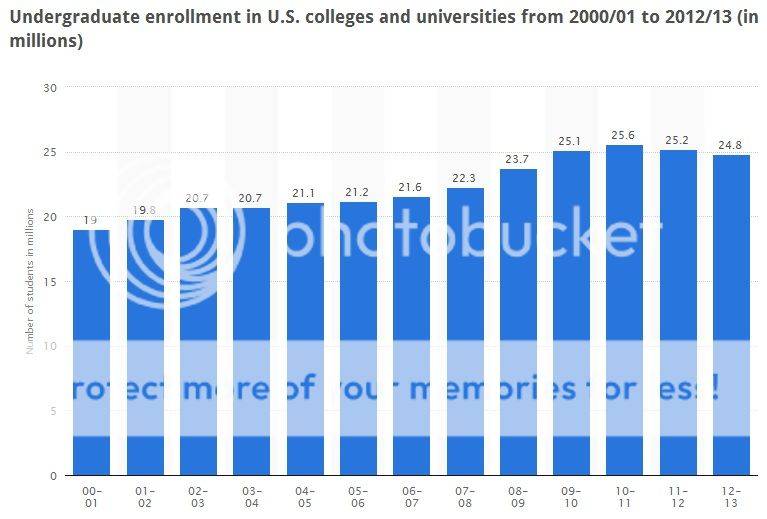
While the native-born working age population increased by 17 million, total university enrollment (native+immigrant+foreign) increased by 5.8 million.
Have you recovered enough from your electroshock to do some basic math? If we grant that all of the increase in university enrollment was from native born working age citizens, all 5.8 million, then how many working age citizens from the 17 million added to the labor force population are not in school and not in a job. Come on think.
The disparity you see in the study means that (1) native born Americans are retiring, leaving the labor force, whereas immigrants are younger and thus entering it, filling the massive gap in productivity we would otherwise face with the Baby Boomers all retiring. It also demonstrates that (2) more native-born individuals are pursuing higher education, thus not entering the work force.
You see, here you are having your delusion again, invoking imaginary data to explain your imaginary population dynamics. You're cute, and you tried to assure me in another thread that you had personally reviewed the research on the educational outcomes of homosexual children. Yeah right, like I believe that.
Now that your electroshock therapy has finished for this session, let me give you some advice. When you talk big and bluff you had better be prepared for someone to call your bluff. Telling people that they need mental help if they accept the findings of a report is you just asking for a slapdown and then to spin a fantastic story based on what the voices in your head tell you represents the real world is you doubling down on the call for a slap down.
Write more judiciously and you won't be so publicly embarrassed by your critics.